Full Report
The numbers behind PT Trimegah Bangun Persada Tbk: as-reported financial statements and company metrics for FY2021–FY2025, traced to the source filings, opened with the share-price history those statements have to justify. Every linked figure opens the exact page of the filing it was printed on, with the statement row highlighted. Amounts in Rp millions unless noted.
Reading notes: Reporting currency is Indonesian Rupiah. The FY2023, FY2024 and FY2025 audited statements are 'Expressed in Millions of Rupiah'; all values in this tab are in Rp millions. The FY2022 Annual Report presents its consolidated statements in FULL Rupiah (e.g. Rp 8,229,175,648,515). FY2021 figures (cited from the FY2022 AR comparative column) therefore carry full-Rupiah citation anchors, while the displayed value is in Rp millions. FY2025 FY2024 are cited from the FY2025 Annual Report (which prints both years); FY2023 FY2022 from the FY2023 Annual Report; FY2021 from the FY2022 Annual Report comparative column. Revenue by segment: FY2021–FY2024 are reported on a GROSS basis (segment revenue including inter-segment sales, with a separate Eliminations line). In FY2025 the company changed the presentation to an EXTERNAL-customer basis, so the FY2025 Nickel Mining figure (Rp 7,178,132m) is external revenue and no eliminations line is shown (Nickel Processing sells only externally, so its figure is comparable across all years). FY2024 gross Nickel Mining revenue was Rp 8,324,375m (Rp 3,801,242m external + Rp 4,523,133m inter-segment eliminated).
Share Price — Available History Since January 2026
The stock closed at IDR 825 on Jul 14, 2026 — down 41% over the window shown, trading between IDR 780 and IDR 1,545.
Source: market price feed, daily closes, Jan 2026–Jul 2026 — the feed marks this available history as partial. Price return only, excludes dividends.
FY2025 at a Glance
Revenue (Rp millions)
Operating income (Rp millions)
Net income (Rp millions)
Source: FY2025 consolidated statements [1] [2] [3] [4]. Click any linked figure to open the filing page with the row highlighted.
Revenue by Segment
| Revenue by Segment | FY2021 | FY2022 | FY2023 | FY2024 | FY2025 |
|---|---|---|---|---|---|
| Nickel Processing | 7,863,259 | 7,107,313 | 20,765,154 | 23,164,020 | 22,454,667 |
| Nickel Mining | 1,542,747 | 4,035,333 | 7,500,147 | 8,324,375 | 7,178,132 |
| Eliminations (inter-segment) | (1,176,830) | (1,574,691) | (4,407,440) | (4,523,133) | — |
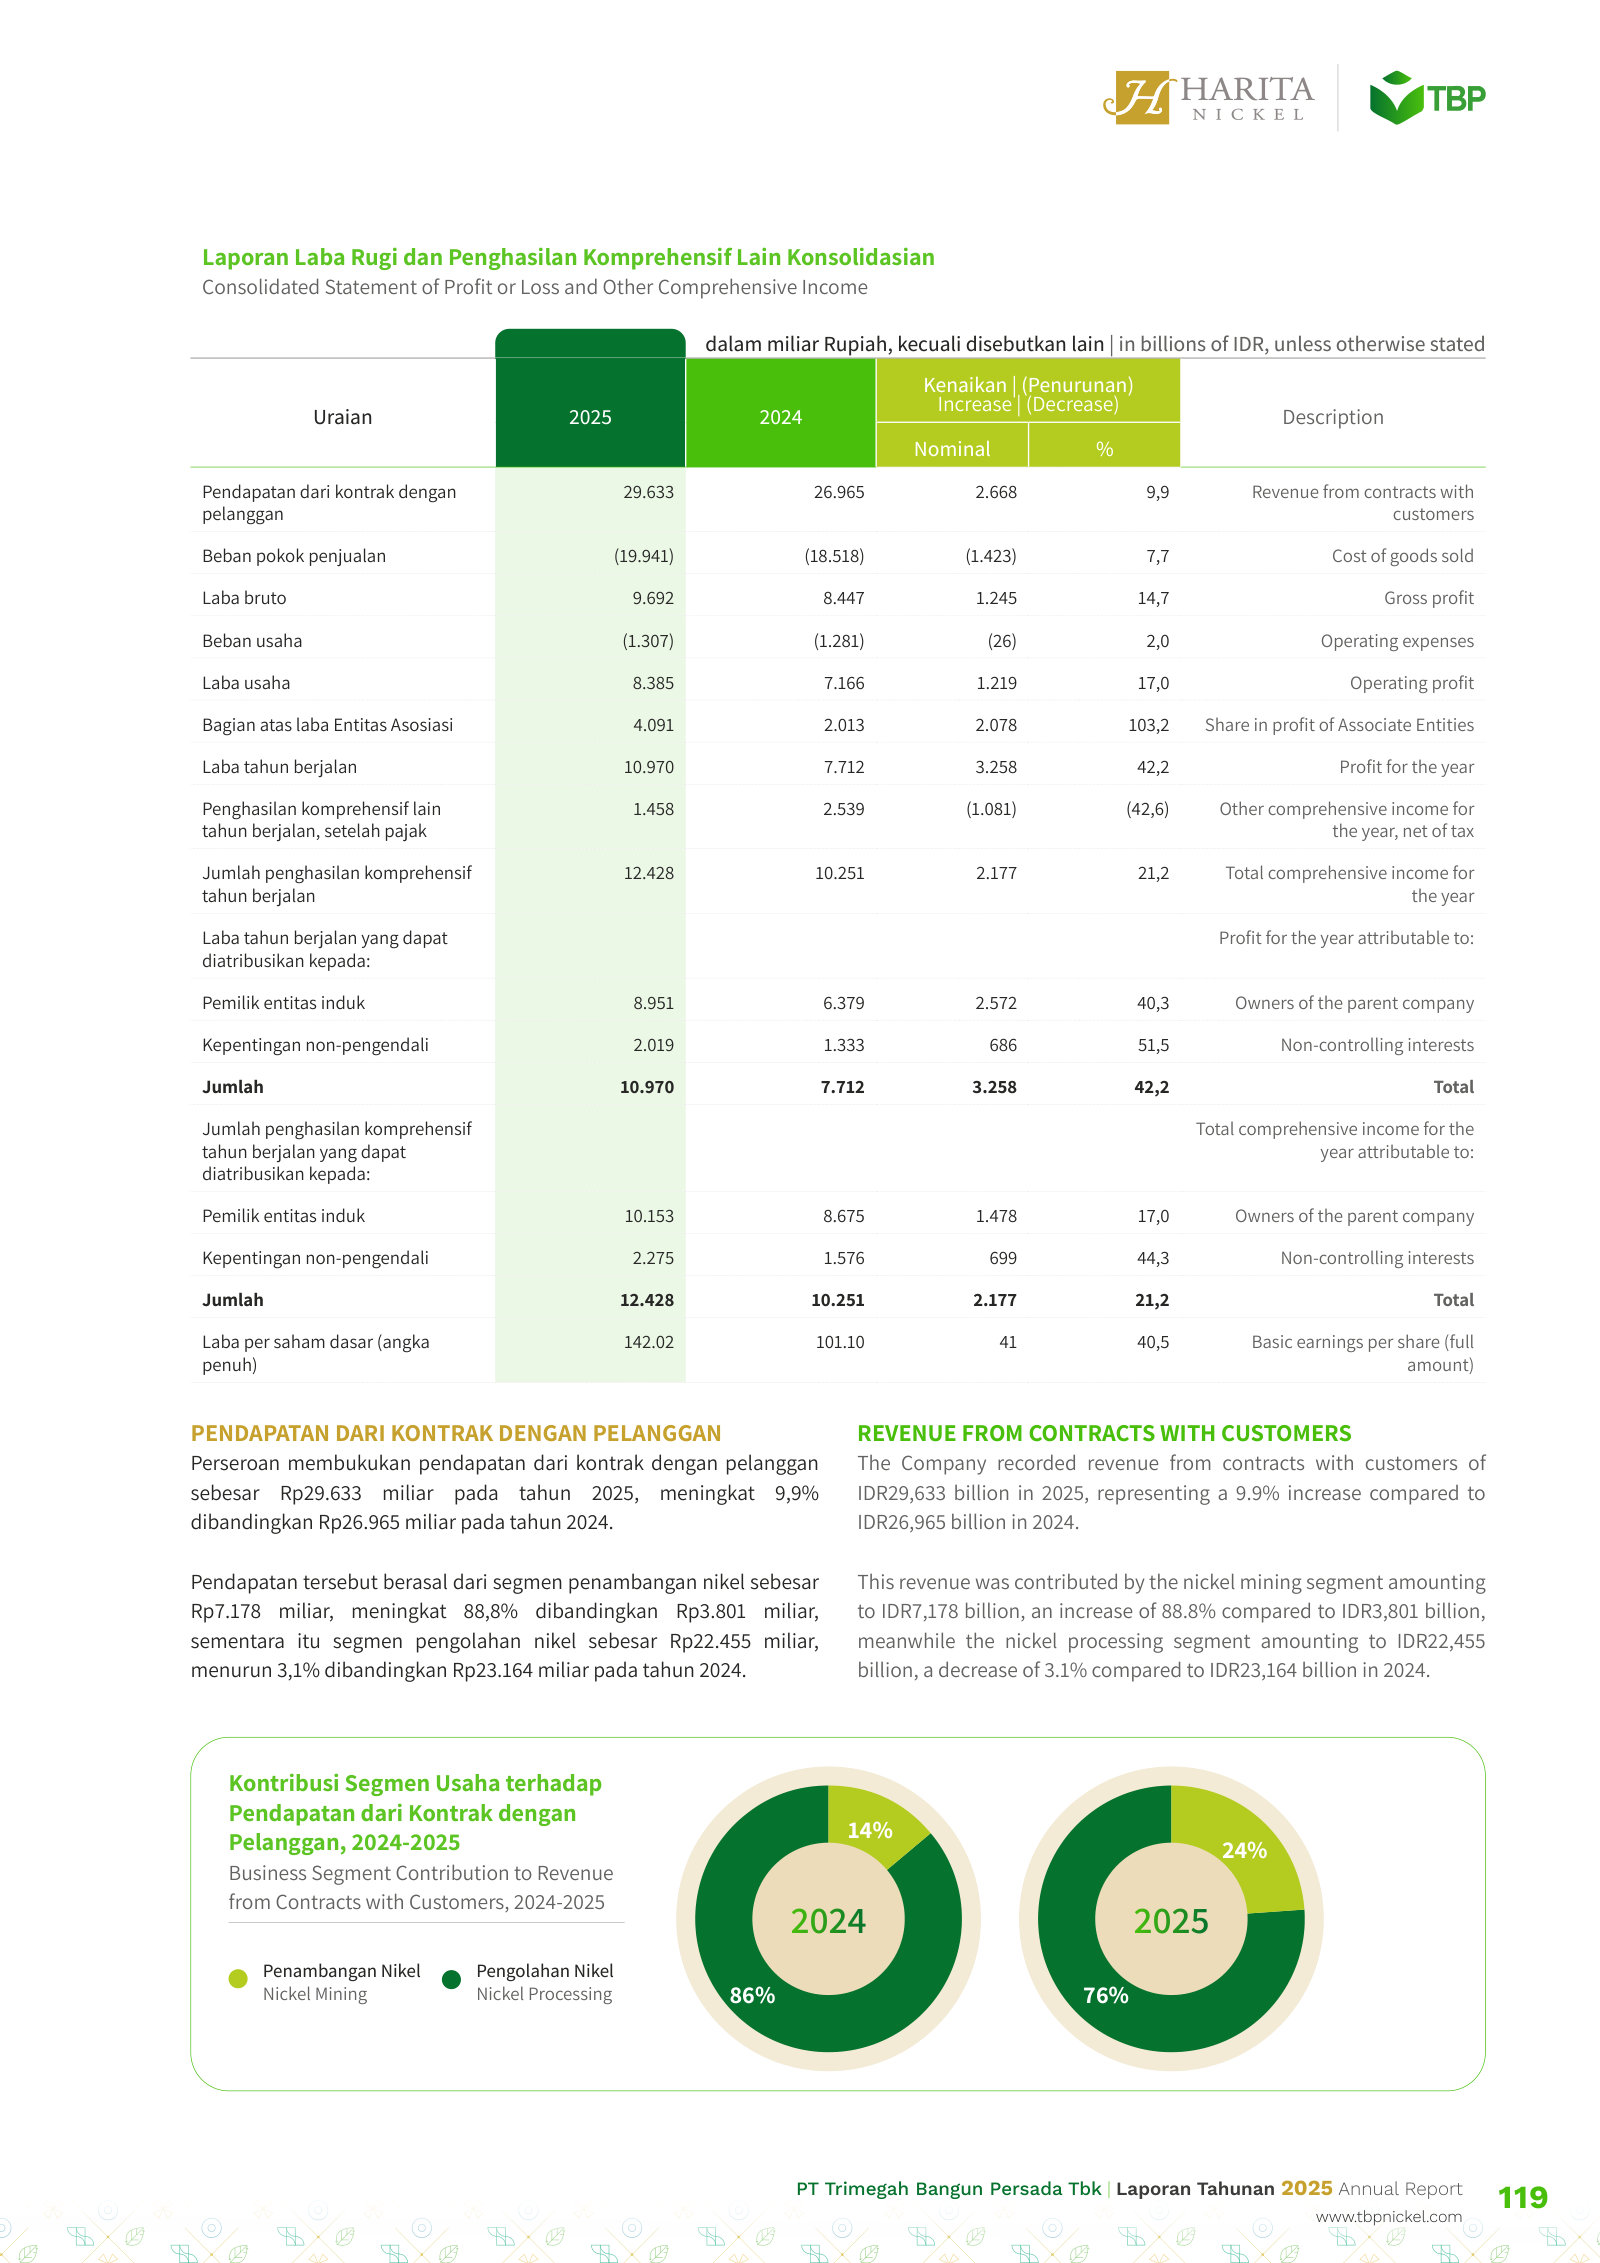
| Total revenue from contracts with customers | 8,229,176 | 9,567,955 | 23,857,861 | 26,965,262 | 29,632,799 |
| Total revenue from contracts with customers growth, derived | — | +16.3% | +149.4% | +13.0% | +9.9% |
Source: Segment Information note (Note 36/37/38). FY2021–FY2024 as reported on a gross basis with inter-segment eliminations; FY2025 on an external-customer basis (see notes). [5] [6] [7] [8]. Click any linked figure to open the filing page with the row highlighted.
Income Statement
Source: Consolidated Statement of Profit or Loss and Other Comprehensive Income [1] [2] [3] [4]. Click any linked figure to open the filing page with the row highlighted.
Columns marked E are consensus analyst estimates shown alongside reported results for direct comparison; they are not company guidance.
Estimate source: analyst consensus (claude_web), as of 2026-07-14. Forecasts carry no filing page links. Consensus revenue sits well below the as-reported line for the last actual year — analysts often model a narrower revenue basis (e.g. net of interest or pass-through costs), so compare trends, not levels.
Balance Sheet
Source: Consolidated Statement of Financial Position [9] [10] [11] [12]. Click any linked figure to open the filing page with the row highlighted.
Cash Flow
Source: Consolidated Statement of Cash Flows [13] [14] [15] [16]. Click any linked figure to open the filing page with the row highlighted.
Nickel Ore Sales Volume
| Nickel Ore Sales Volume | FY2021 | FY2022 | FY2023 | FY2024 | FY2025 |
|---|---|---|---|---|---|
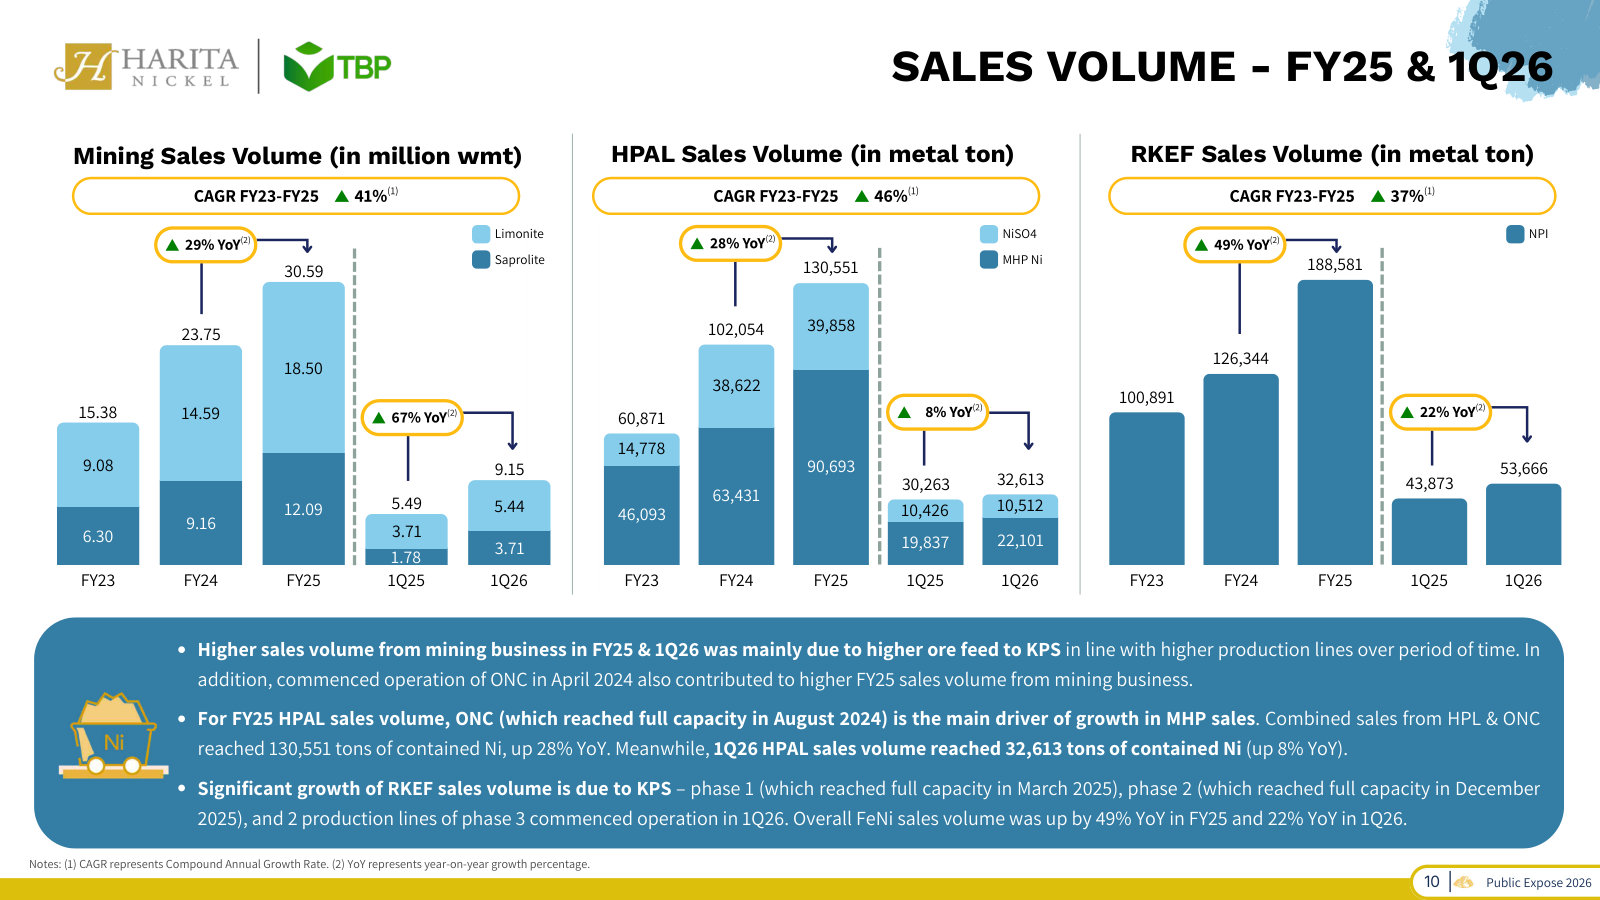
| Total nickel ore sales (million WMT) | — | 7.77 | 15.38 | 23.75 | 30.59 |
| Saprolite ore sales (million WMT) | — | 1.88 | 6.30 | 9.16 | 12.09 |
| Limonite ore sales (million WMT) | — | 5.89 | 9.08 | 14.59 | 18.50 |
Source: company filings [17] [18] [19] [20]. Click any linked figure to open the filing page with the row highlighted.
Downstream Processing — Sales Volume Installed Capacity
| Downstream Processing — Sales Volume Installed Capacity | FY2021 | FY2022 | FY2023 | FY2024 | FY2025 |
|---|---|---|---|---|---|
| FeNi sales volume (tonnes Ni content) | — | — | 100,891 | 126,344 | 188,581 |
| MHP derivatives (NiSO4) sales (metal tonnes) | — | — | 60,871 | 102,054 | 130,551 |
| RKEF installed capacity (tonnes Ni in FeNi / yr) | — | — | — | — | 240,000 |
| HPAL installed capacity (tonnes Ni-Co compound / yr) | — | — | — | — | 120,000 |
Source: company filings [21] [17] [19]. Click any linked figure to open the filing page with the row highlighted.
Market Pricing, Reserves Workforce
| Market Pricing, Reserves Workforce | FY2021 | FY2022 | FY2023 | FY2024 | FY2025 |
|---|---|---|---|---|---|
| Average nickel price — LME (US$/tonne) | — | 25,834 | 21,521 | — | 15,160 |
| Nickel ore reserves resources (million WMT) | — | — | — | 309.7 | 310.8 |
| Total employees (Group, incl. subsidiaries) | 5,313 | 9,721 | 11,961 | 12,374 | 12,530 |
Source: company filings [22] [23] [24] [25]. Click any linked figure to open the filing page with the row highlighted.
Long-Term Record
| Fiscal year | Total revenue | Operating profit | Net income | Basic EPS | Operating cash flow | Total equity |
|---|---|---|---|---|---|---|
| FY2019 | 6,892,503 | 2,496,164 | 1,074,675 | 21.21 | 2,221,706 | 5,967,150 |
| FY2020 | 4,071,638 | 1,242,185 | 80,555 | 5.16 | 653,843 | 8,479,775 |
| FY2021 | 8,229,176 | 3,566,908 | 2,076,818 | 35.73 | 1,832,229 | 9,542,267 |
| FY2022 | 9,567,955 | 3,983,616 | 4,588,805 | 84.70 | 3,524,508 | 14,229,133 |
| FY2023 | 23,857,861 | 7,023,989 | 7,068,054 | 92.39 | 6,785,478 | 28,391,963 |
| FY2024 | 26,965,262 | 7,166,381 | 7,712,368 | 101.10 | 5,708,382 | 36,454,054 |
| FY2025 | 29,632,799 | 8,384,607 | 10,970,337 | 142.02 | 8,601,085 | 46,755,865 |
Source: consolidated statements across filings; older years from the standardized feed [14] [1] [2] [9]. Click any linked figure to open the filing page with the row highlighted.
Analyst Consensus
Mean target
Street ratings: Consensus: Strong Buy. Approximately 13 analysts covering — 12-13 Buy, 0 Hold, 0 Sell. Mean 12-month price target 1,569.54 IDR per Simply Wall St/Yahoo (13 analysts; high 1,900 / low 1,200 IDR); Investing.com shows a mean of 1,631.27 IDR (11-12 analysts, same 1,900/1,200 high-low). All figures in IDR.
Estimate source: analyst consensus (claude_web), as of 2026-07-14. Forecasts carry no filing page links. Consensus revenue sits well below the as-reported line for the last actual year — analysts often model a narrower revenue basis (e.g. net of interest or pass-through costs), so compare trends, not levels.
Traceability
269 of 281 figures on this page (96%) link to the filing page where they are printed — click a linked figure to open the source PDF at that page with the row highlighted. Unlinked figures come from standardized data feeds or pre-filing years.
Reporting currency is Indonesian Rupiah. The FY2023, FY2024 and FY2025 audited statements are 'Expressed in Millions of Rupiah'; all values in this tab are in Rp millions.
The FY2022 Annual Report presents its consolidated statements in FULL Rupiah (e.g. Rp 8,229,175,648,515). FY2021 figures (cited from the FY2022 AR comparative column) therefore carry full-Rupiah citation anchors, while the displayed value is in Rp millions.
FY2025 FY2024 are cited from the FY2025 Annual Report (which prints both years); FY2023 FY2022 from the FY2023 Annual Report; FY2021 from the FY2022 Annual Report comparative column.
Revenue by segment: FY2021–FY2024 are reported on a GROSS basis (segment revenue including inter-segment sales, with a separate Eliminations line). In FY2025 the company changed the presentation to an EXTERNAL-customer basis, so the FY2025 Nickel Mining figure (Rp 7,178,132m) is external revenue and no eliminations line is shown (Nickel Processing sells only externally, so its figure is comparable across all years). FY2024 gross Nickel Mining revenue was Rp 8,324,375m (Rp 3,801,242m external + Rp 4,523,133m inter-segment eliminated).
FY2024 segment revenue is cited to the FY2024 audited financial statements (Note 38, gross basis); FY2025 to the FY2025 audited financial statements (Note 37, external basis).
FY2019 and FY2020 long-term figures are from the standardized data feed (originally the IPO prospectus, in full Rupiah) and are shown without page links.
Quarterly balance sheet is point-in-time as printed in each interim report. Quarterly operating cash flow is derived from the printed year-to-date interim cash-flow statements (see the cash-flow statement note); the corpus has no quarterly cash-flow data feed for cross-check.
Analyst consensus estimates are available in data/estimates/analyst_estimates.json and are read directly by the renderer.
2 figure(s) differed between the data feed and the filing; the filing value is shown (see the run's metrics/metrics_tab.json for the audit trail).
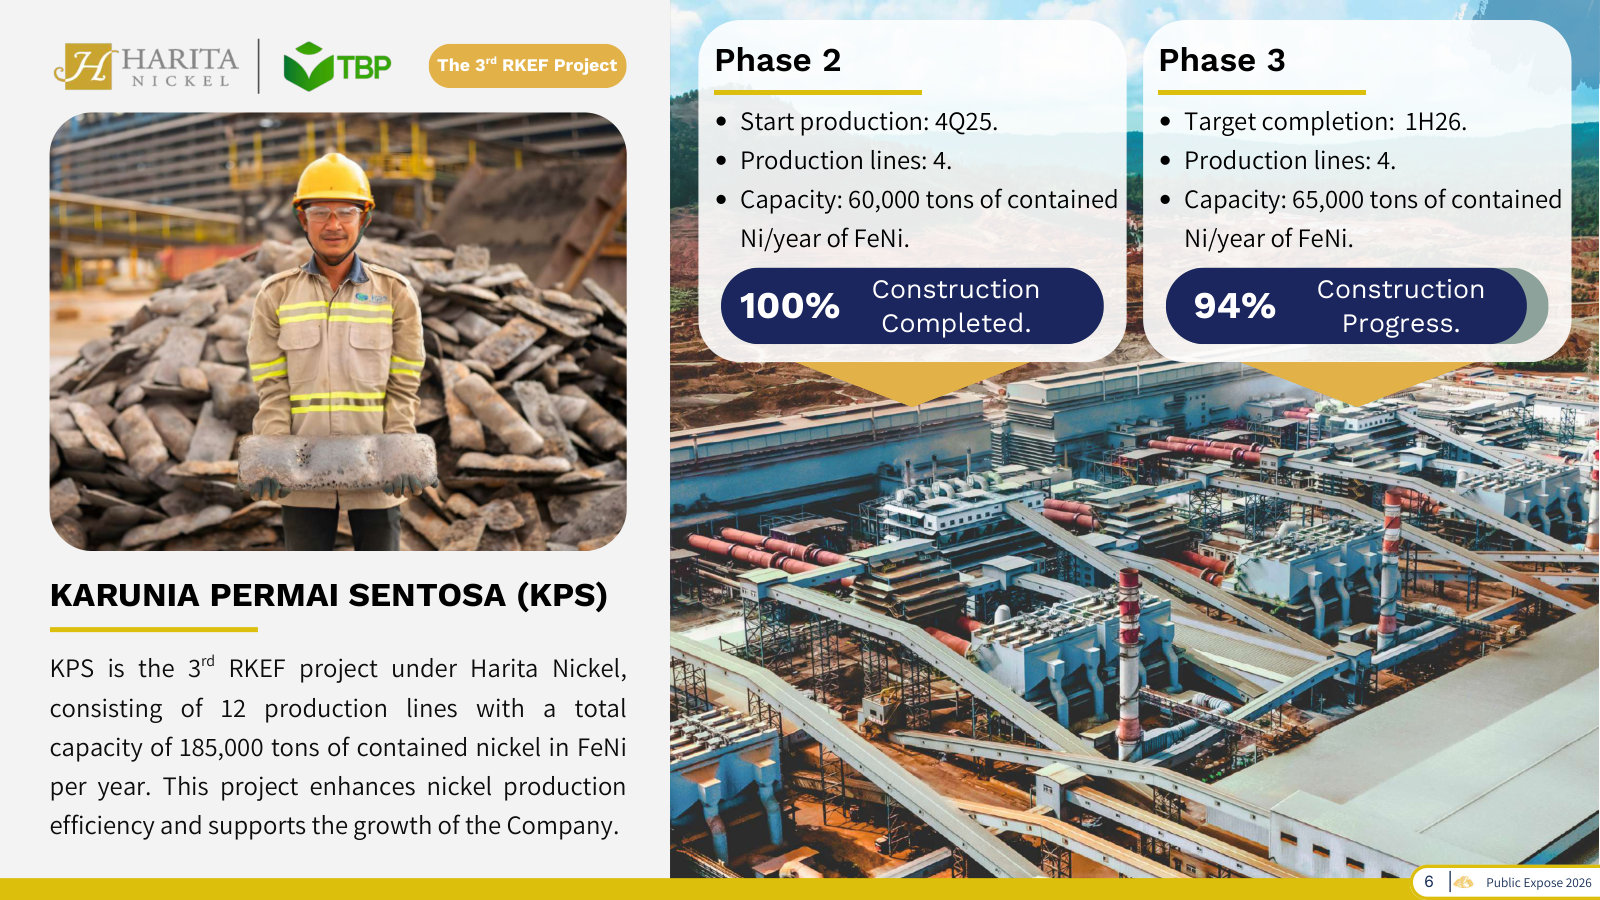
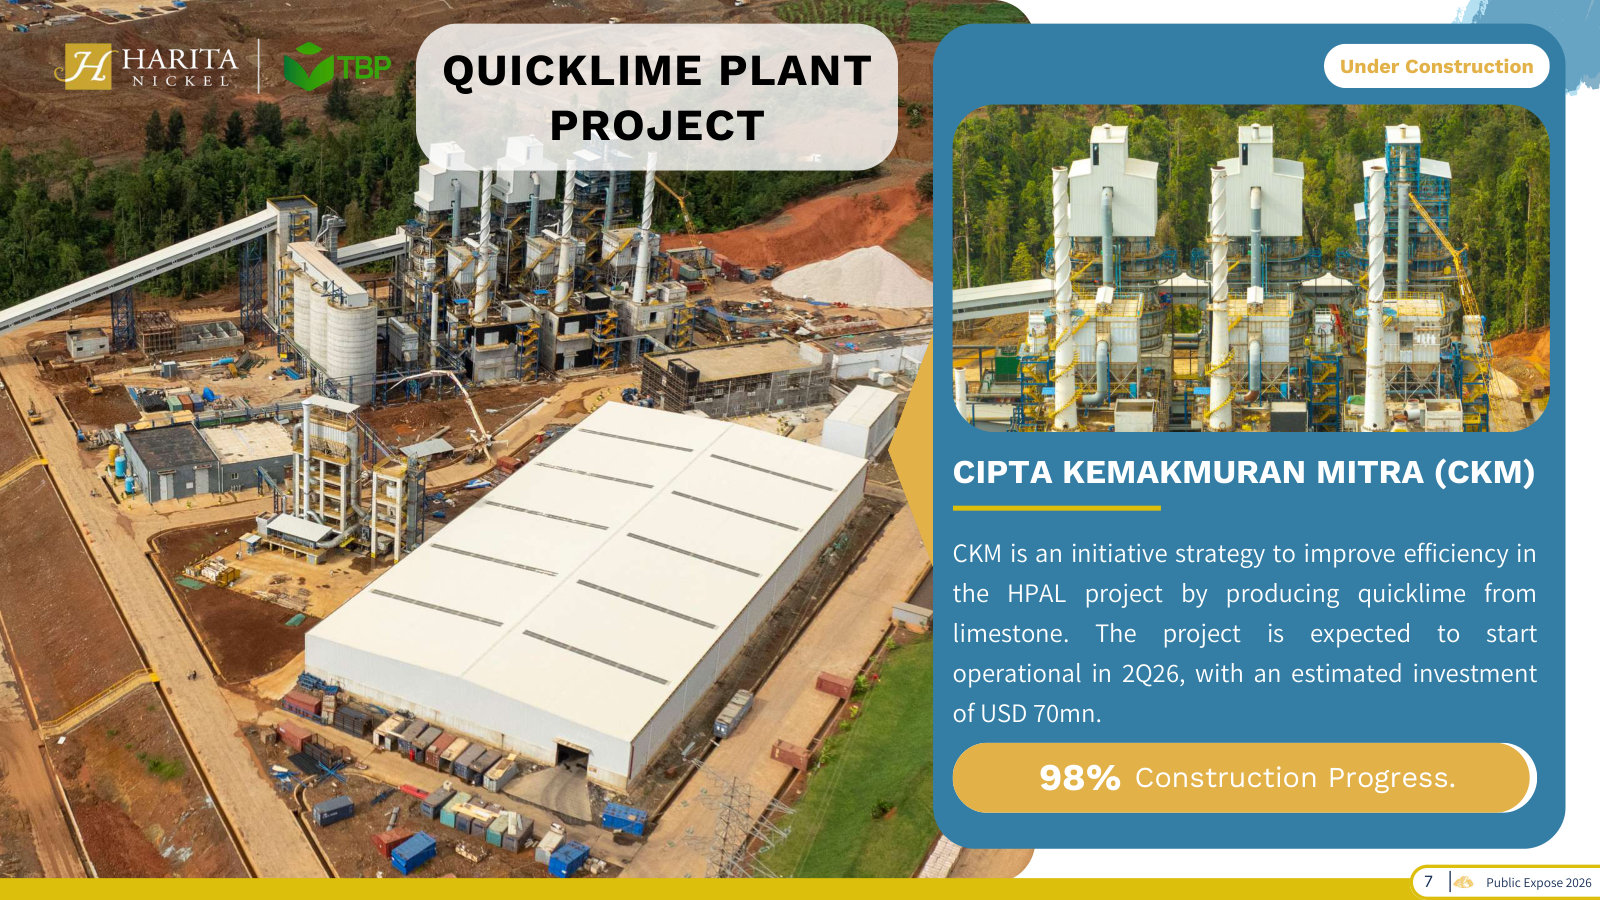
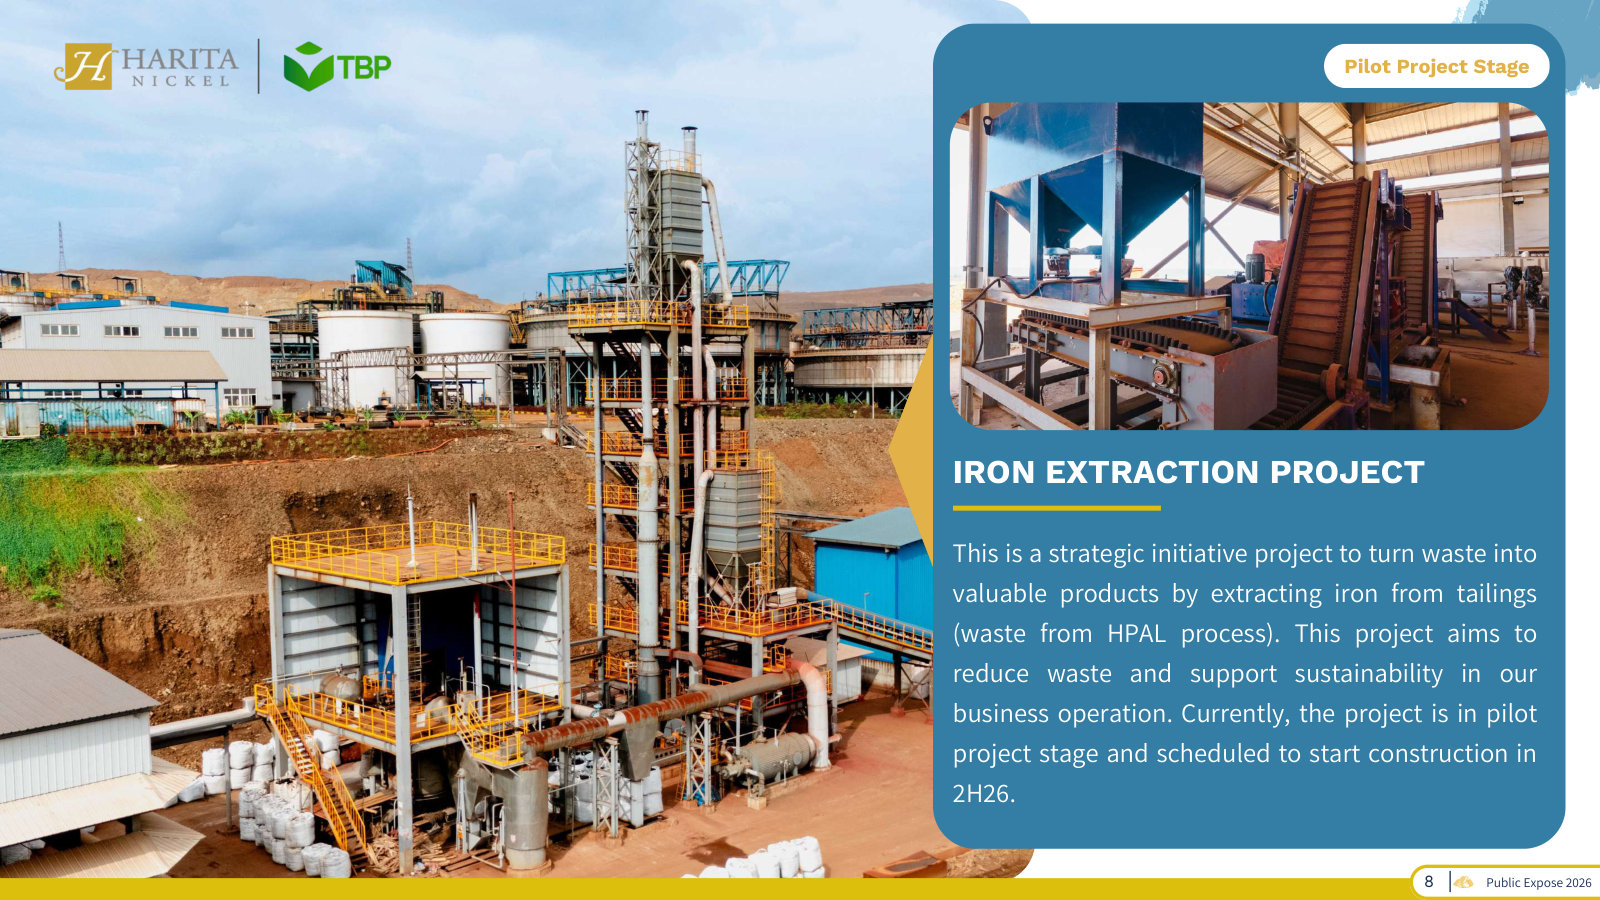
PT Trimegah Bangun Persada Tbk's management explains the business in its own materials. The slides below do the most of that work, pulled from the documents preserved in Sources. Each source link opens the complete presentation at that slide in a new tab.
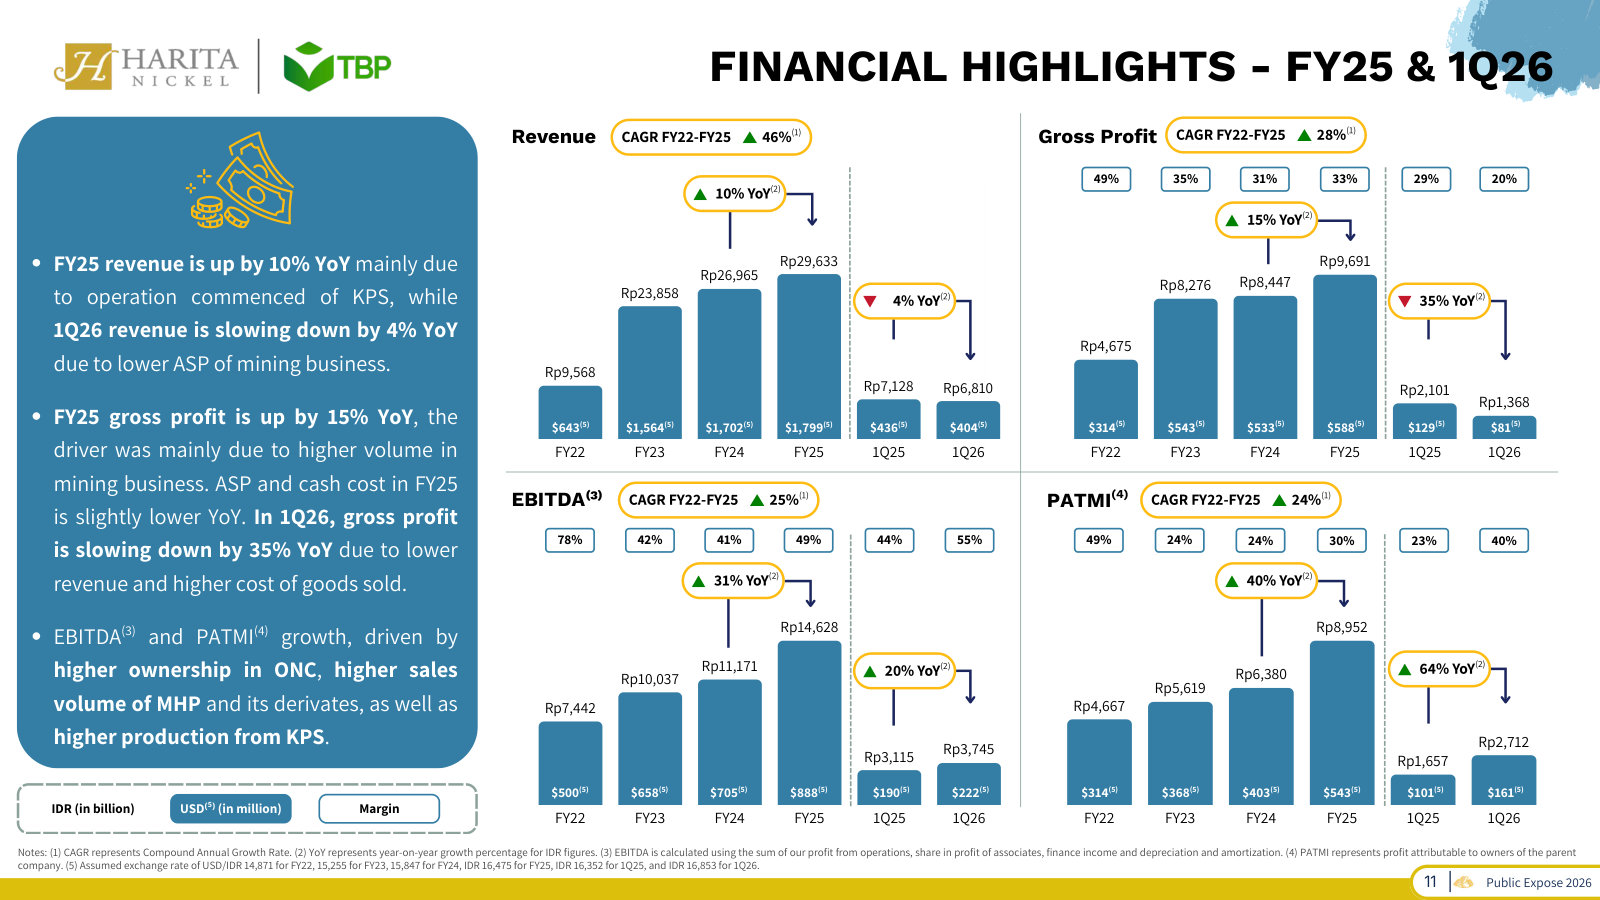
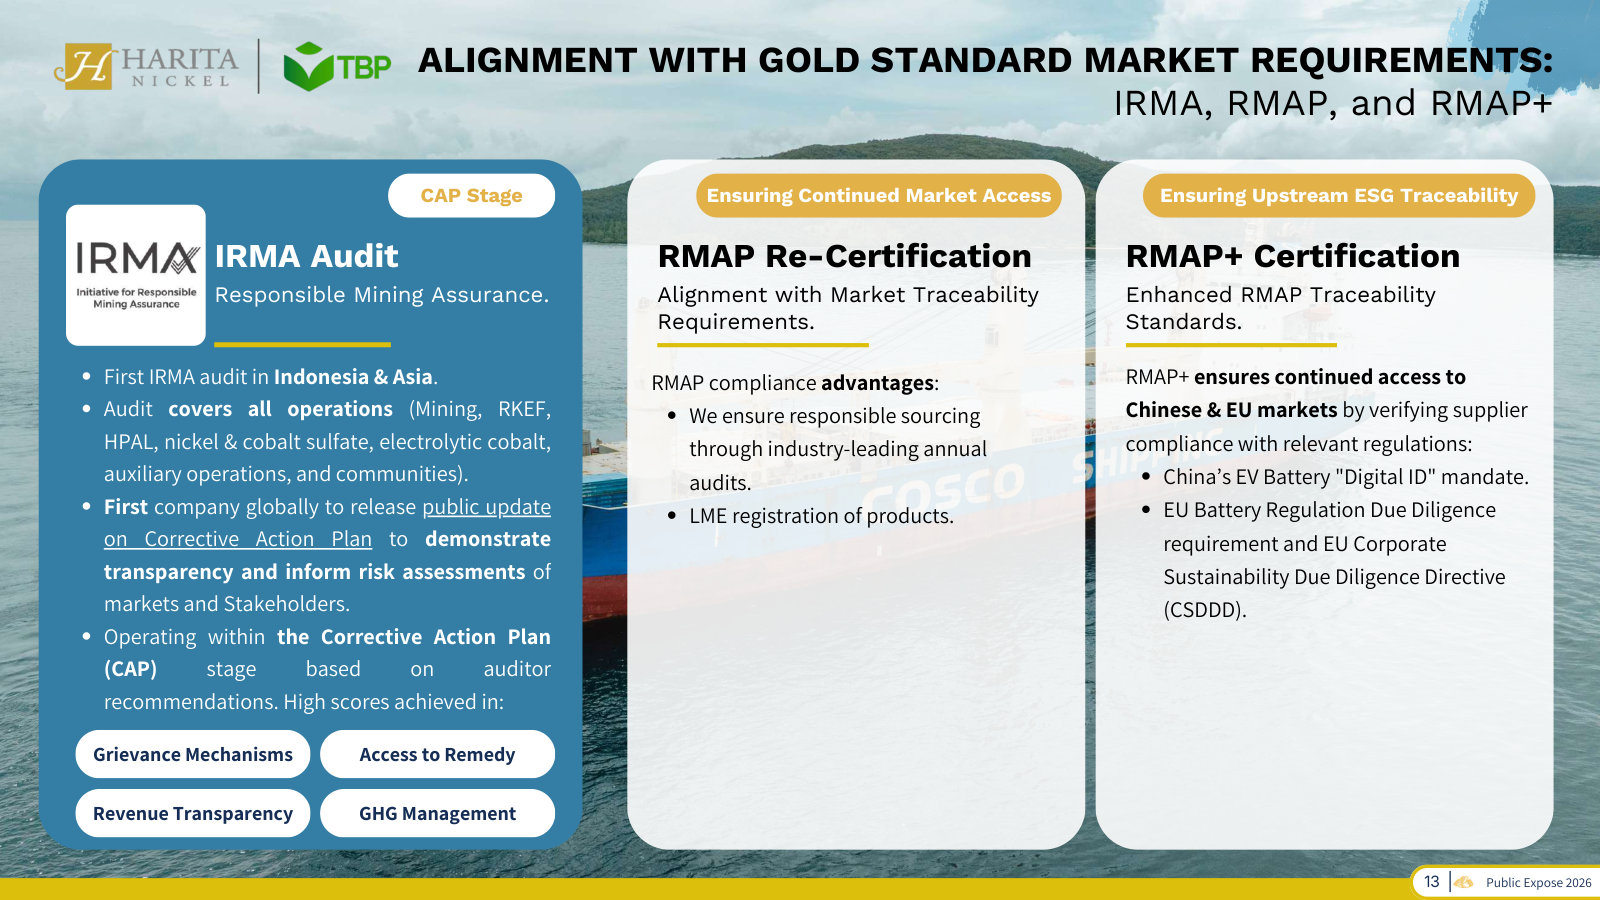
Public Expose 2026 — FY25 / 1Q26
Management's newest company overview: current volumes and financials across all three routes, the project pipeline, and why certification gates market access. · Open the full document →
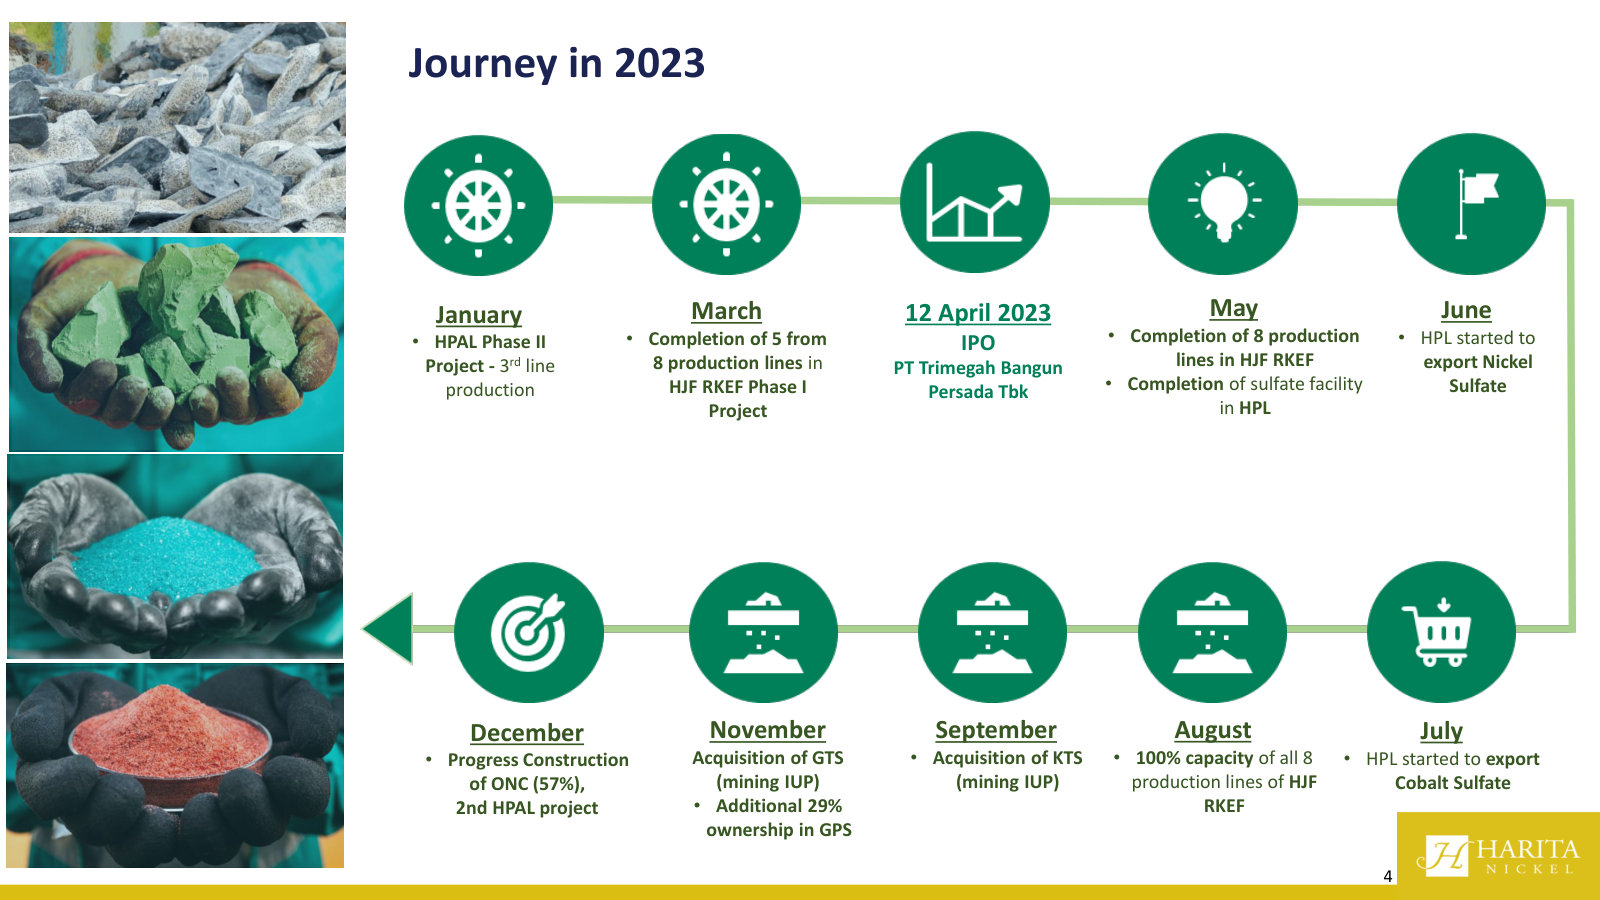
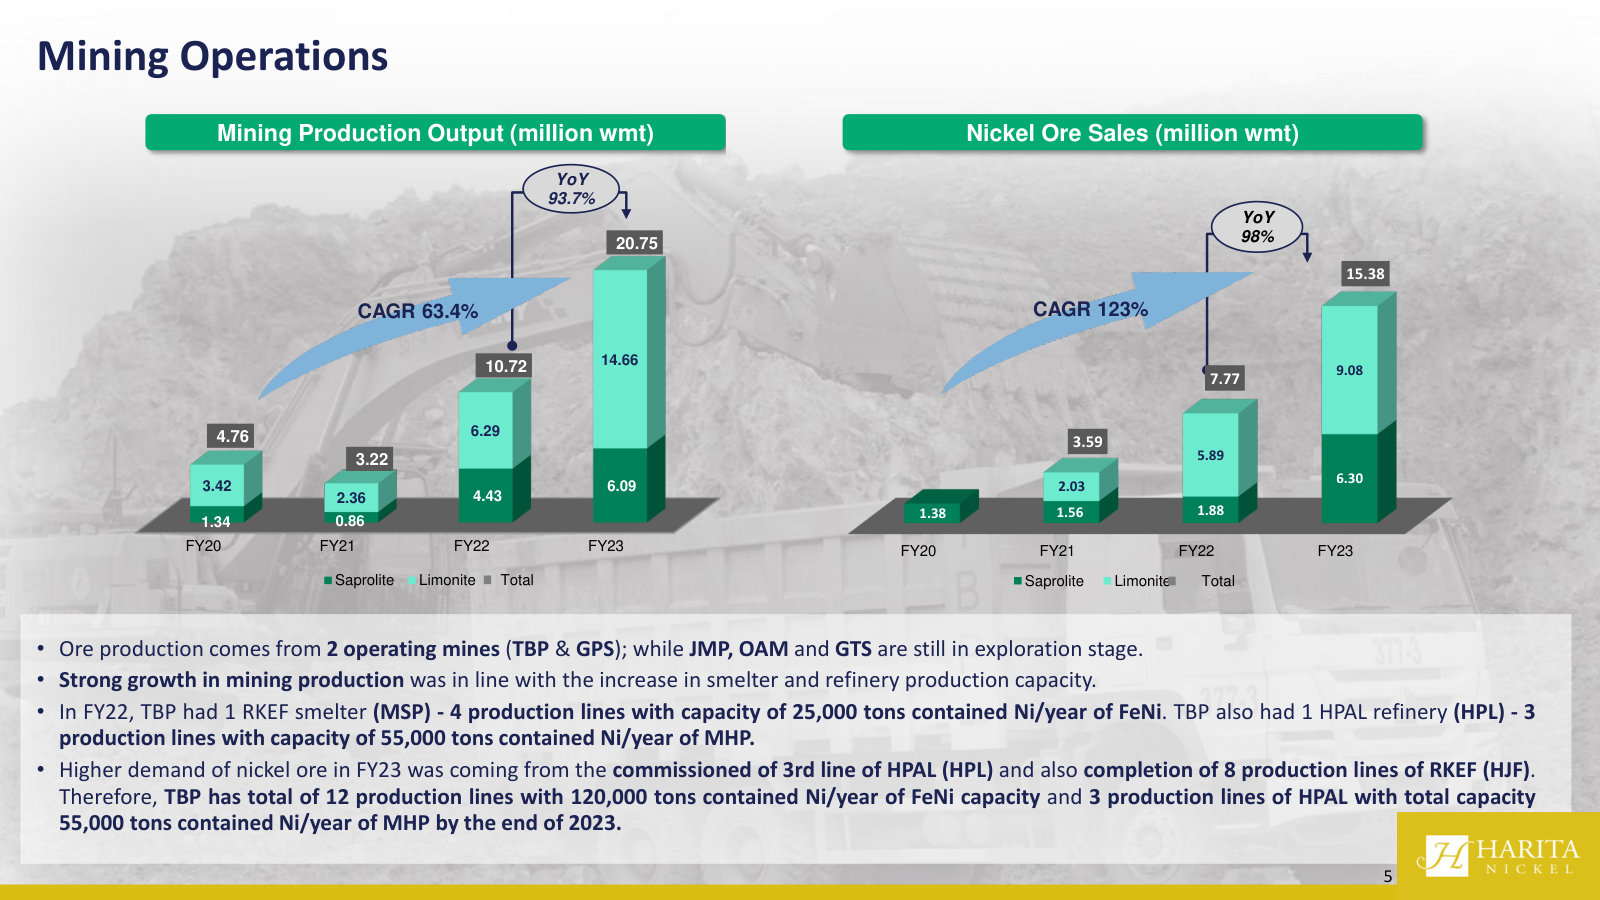
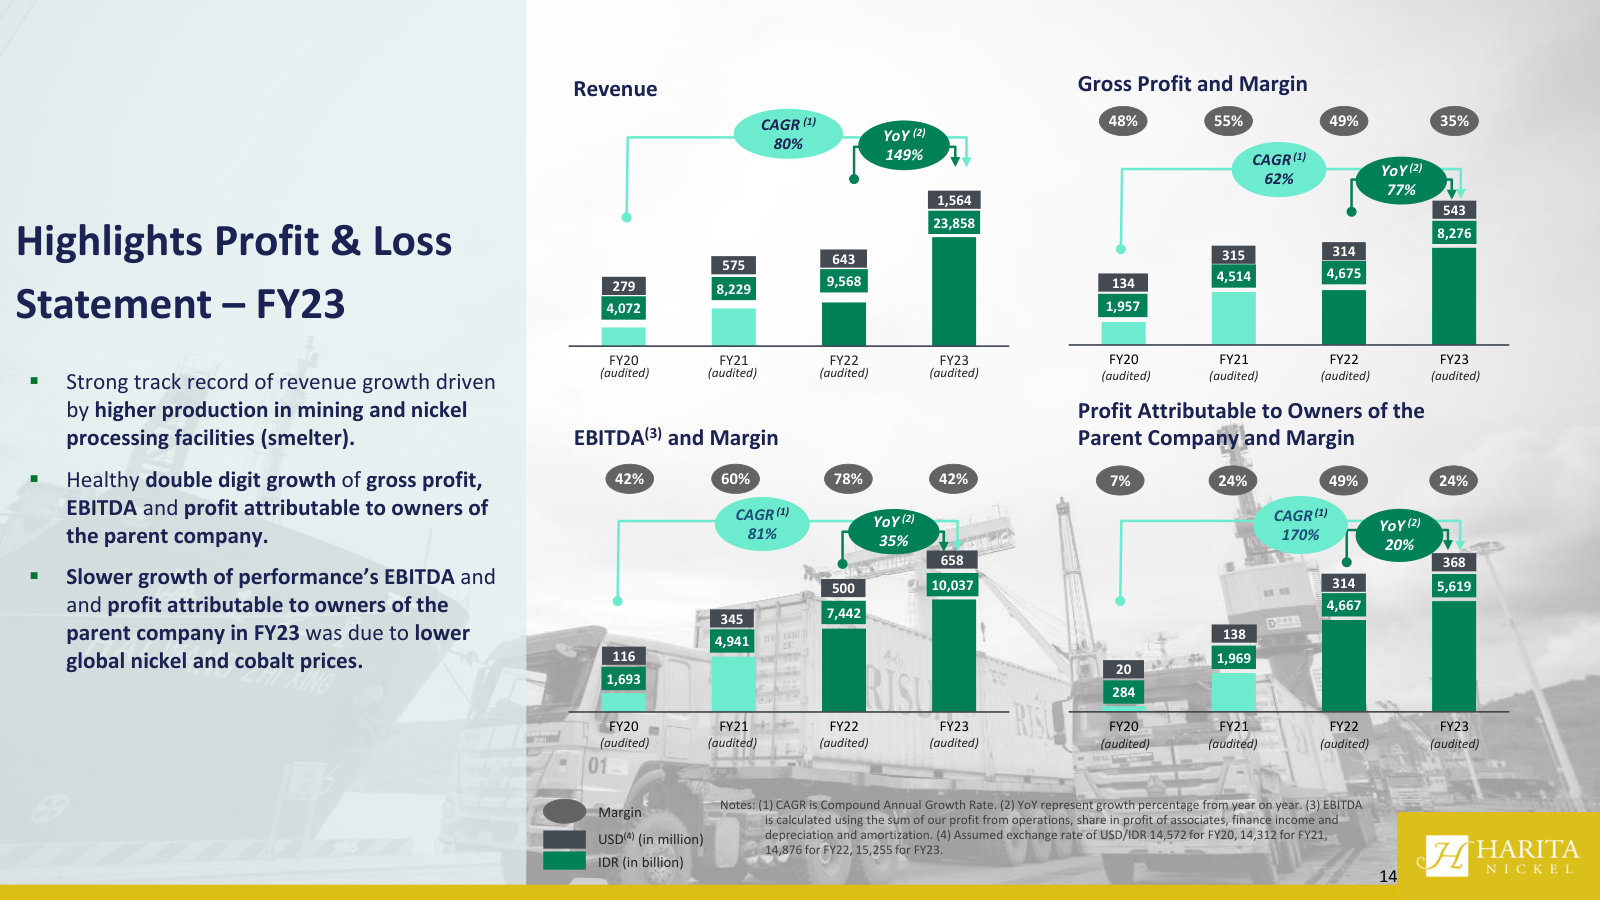
Company Presentation FY23 (Analyst Call) — FY23
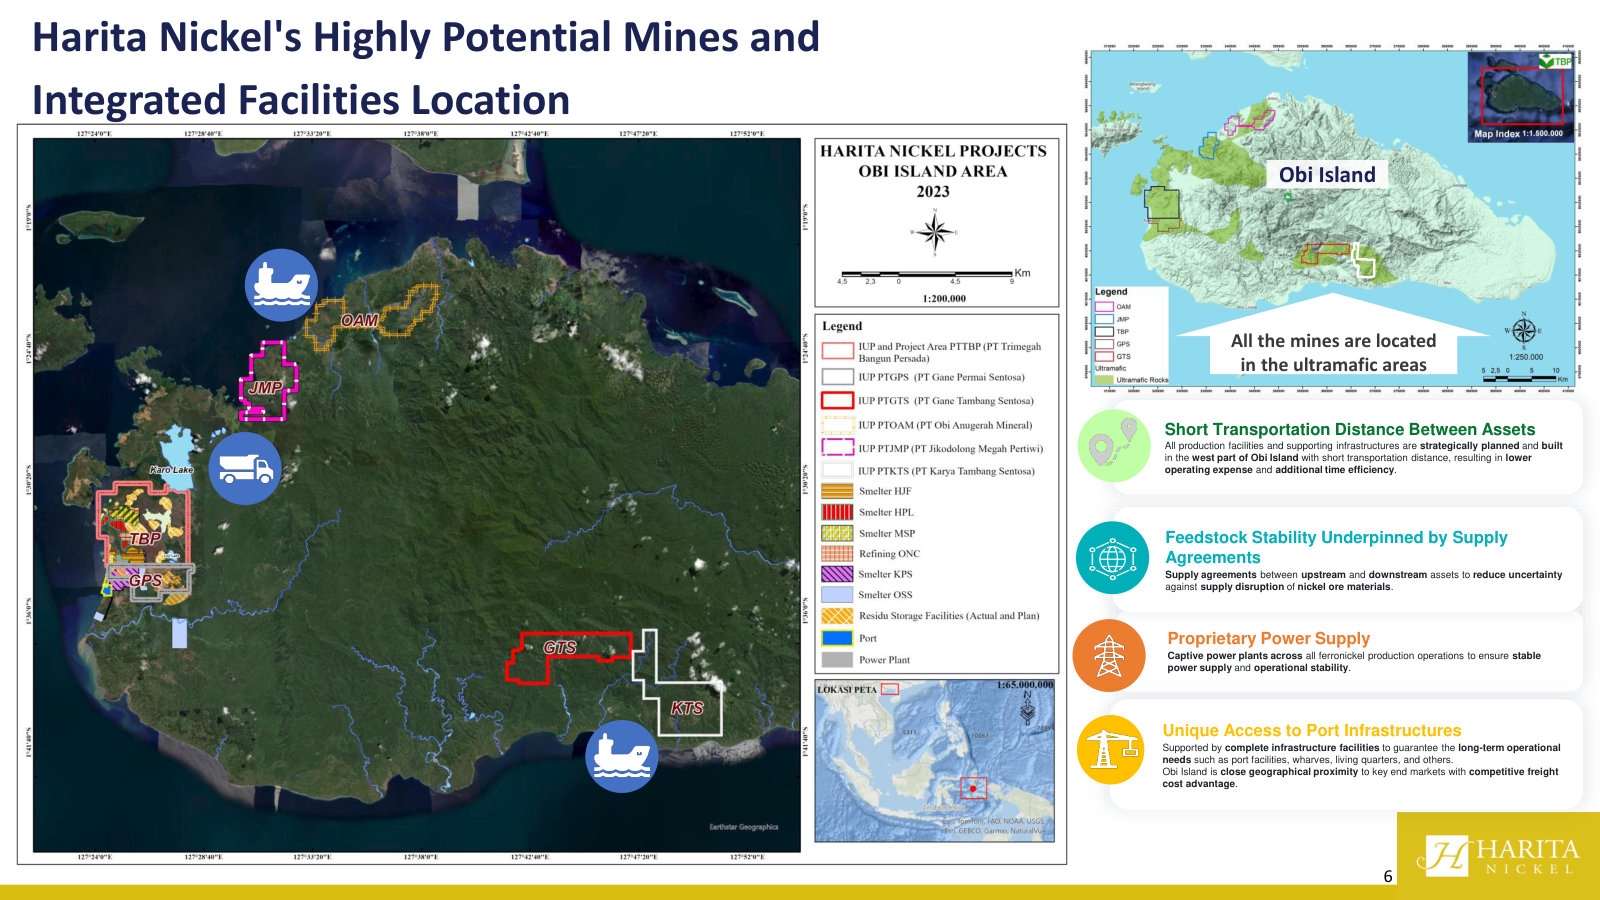
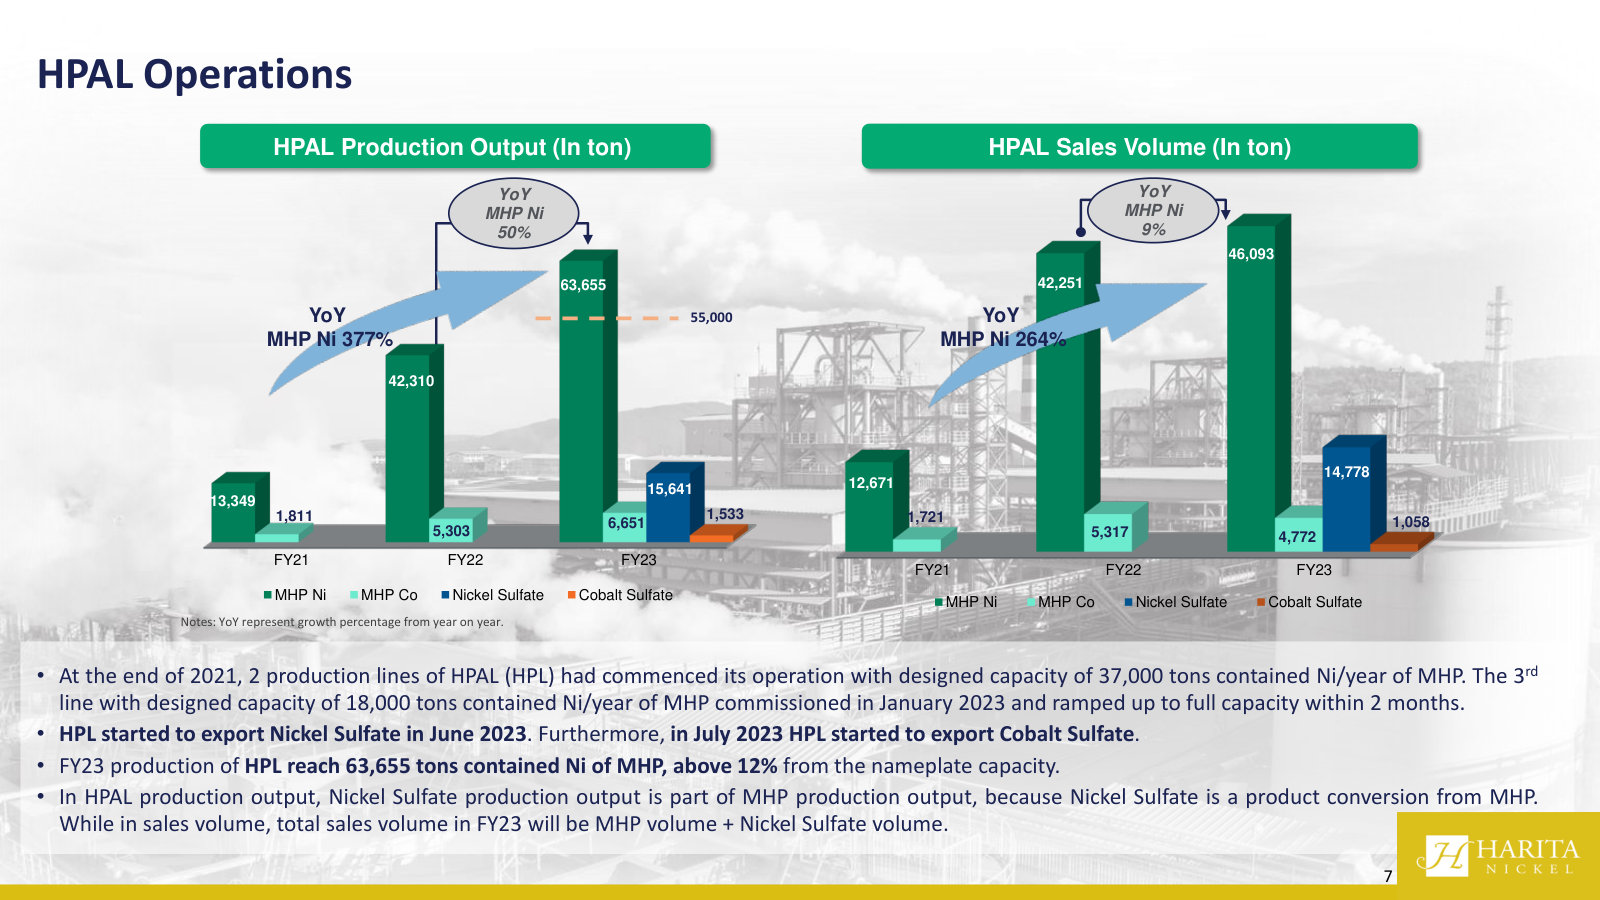
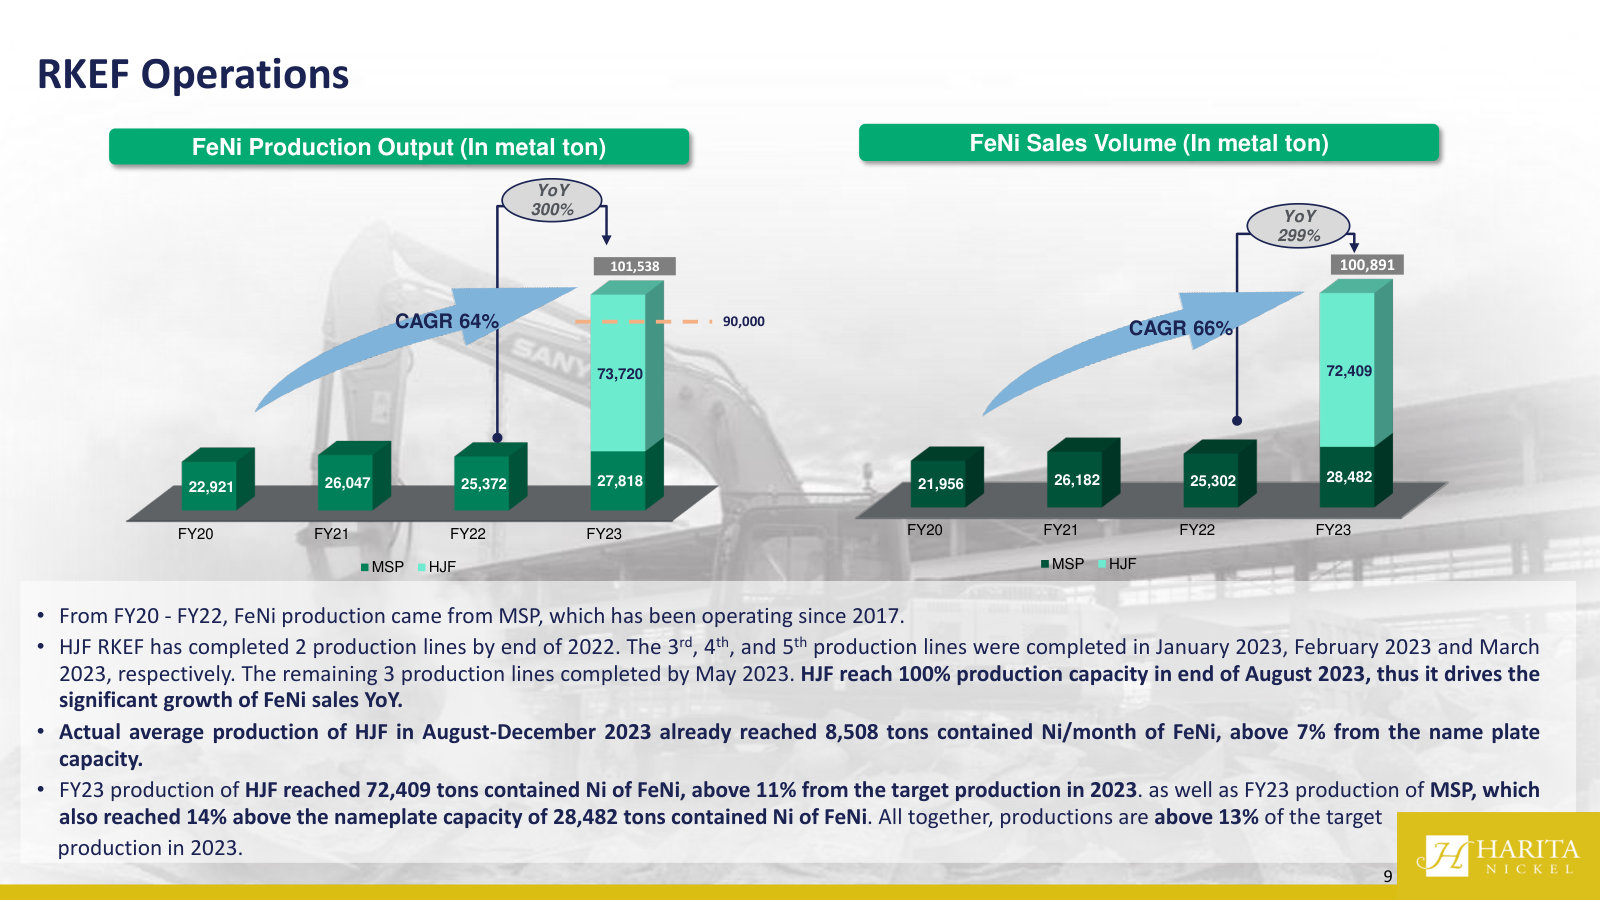
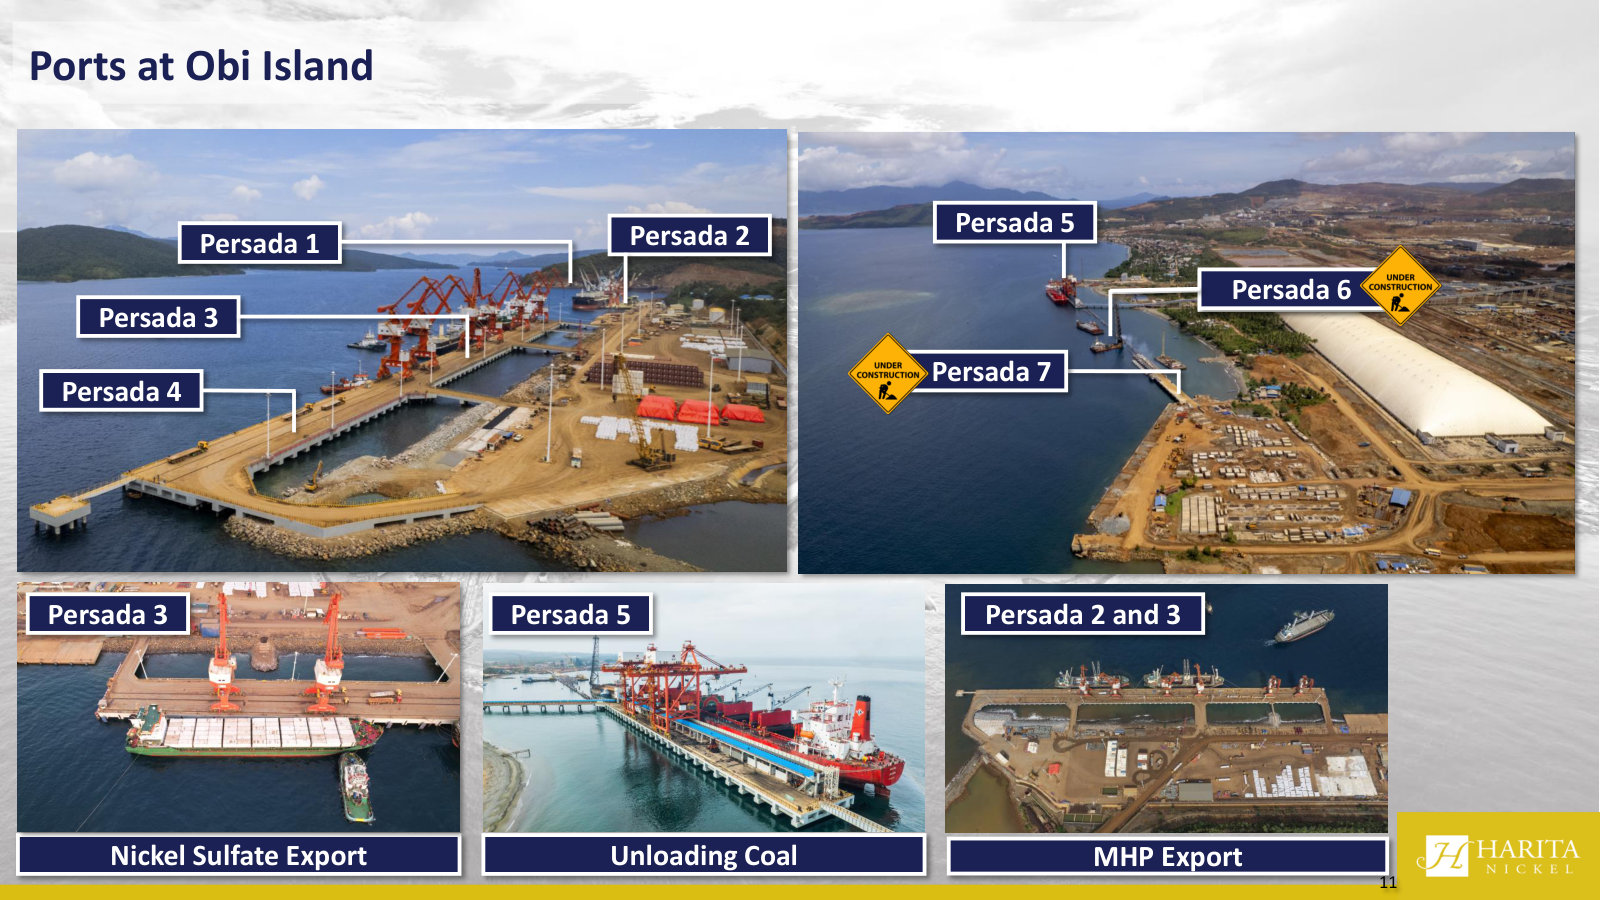
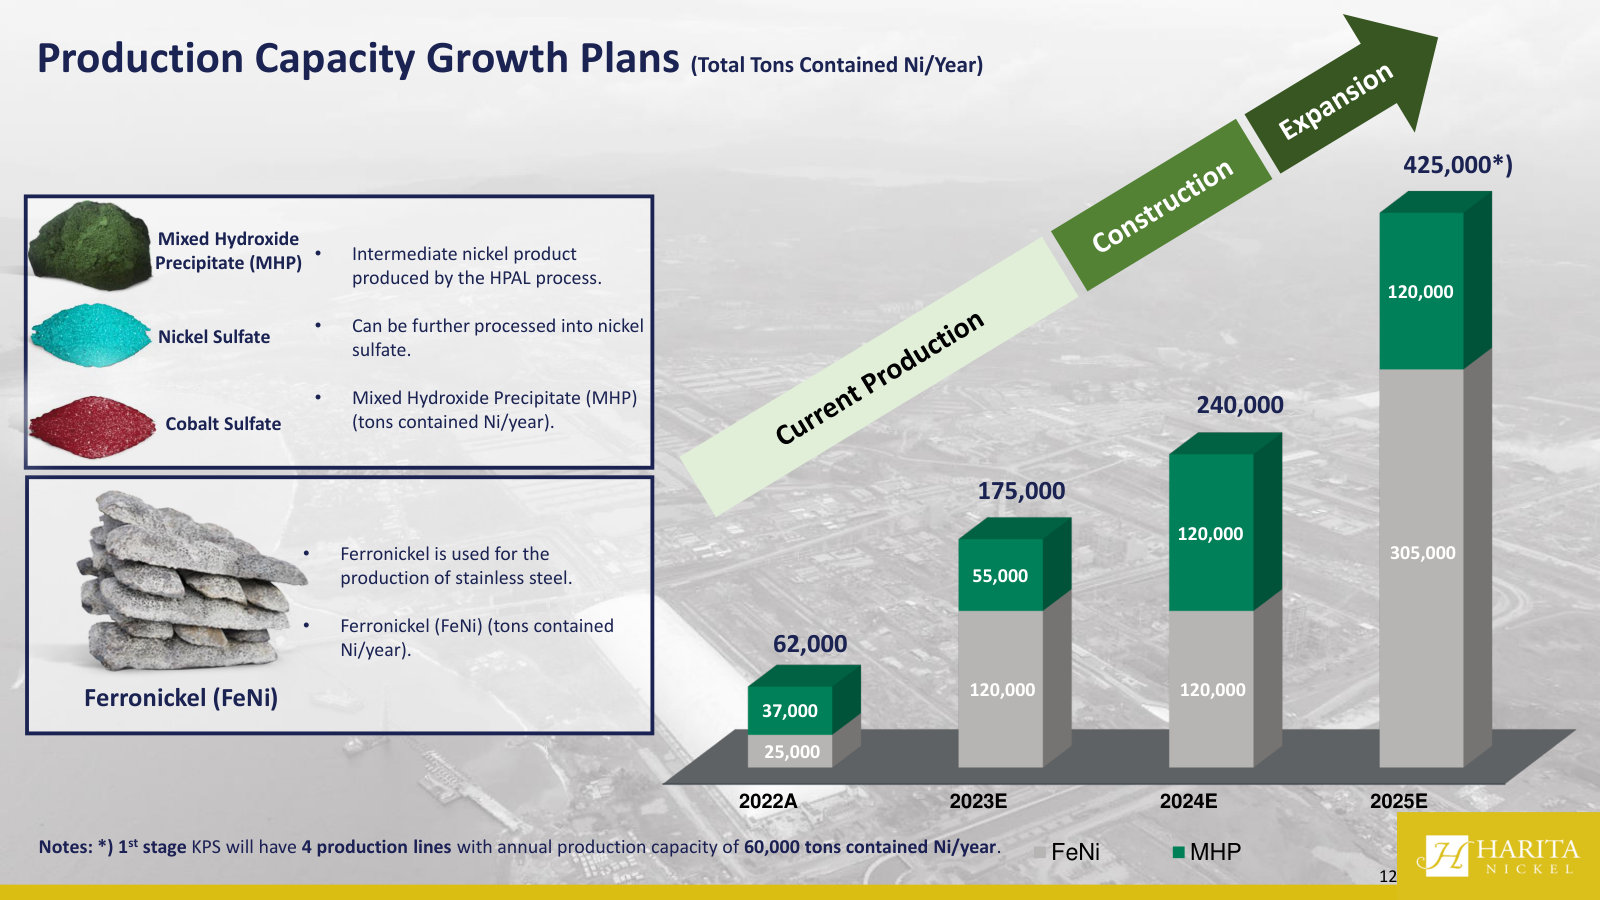
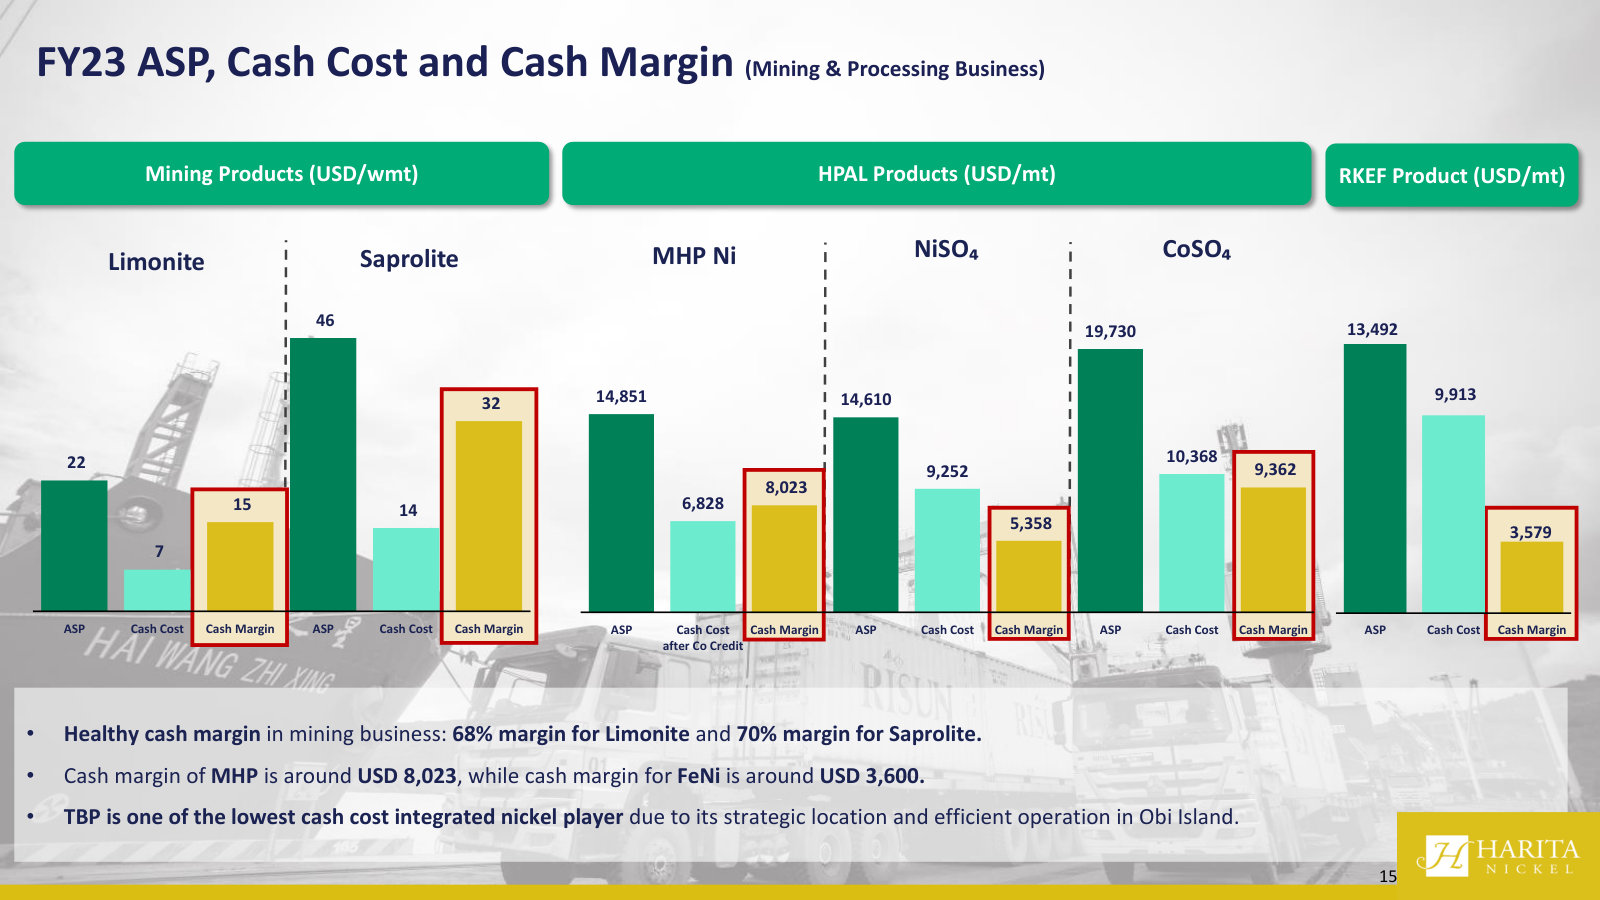
The fullest walk-through of how the business is actually built — geography, the two processing routes, ports, capacity by product, and per-product economics — content later decks dropped. · Open the full document →
More from management
Analyst Call 9M25 — 9M25 · 22 pages · The last analyst-call deck before the Public Expose — 9M25 financials and construction progress on KPS, quicklime and iron extraction. · Open →
Company Presentation FY24 (Analyst Call) — FY24 · 20 pages · The FY24 full-year numbers and the project pipeline (KPS, GTS mining, quicklime, jetties) as management framed it a year earlier. · Open →
Company Presentation 9M24 — 9M24 · 23 pages · Carries the 2024 ore reserves table and the launch of electrolytic cobalt — reserve base and product detail absent from the featured decks. · Open →
Company Presentation 9M23 — 9M23 · 30 pages · The first post-IPO deck: reserve base, reserve-replacement strategy, and the GTS/KTS/GPS acquisitions that expanded the resource. · Open →
PT Trimegah Bangun Persada Tbk (Harita Nickel)'s annual reports contain management's most considered account of the business. These are the sections, passages and visual pages worth opening in the originals preserved in Sources.
Harita Nickel (PT Trimegah Bangun Persada Tbk) — FY2025 Annual Report — FY2025
The latest report — management's fullest account of an integrated Obi Island nickel miner-processor after the KPS smelter ramp. · Open the full document →
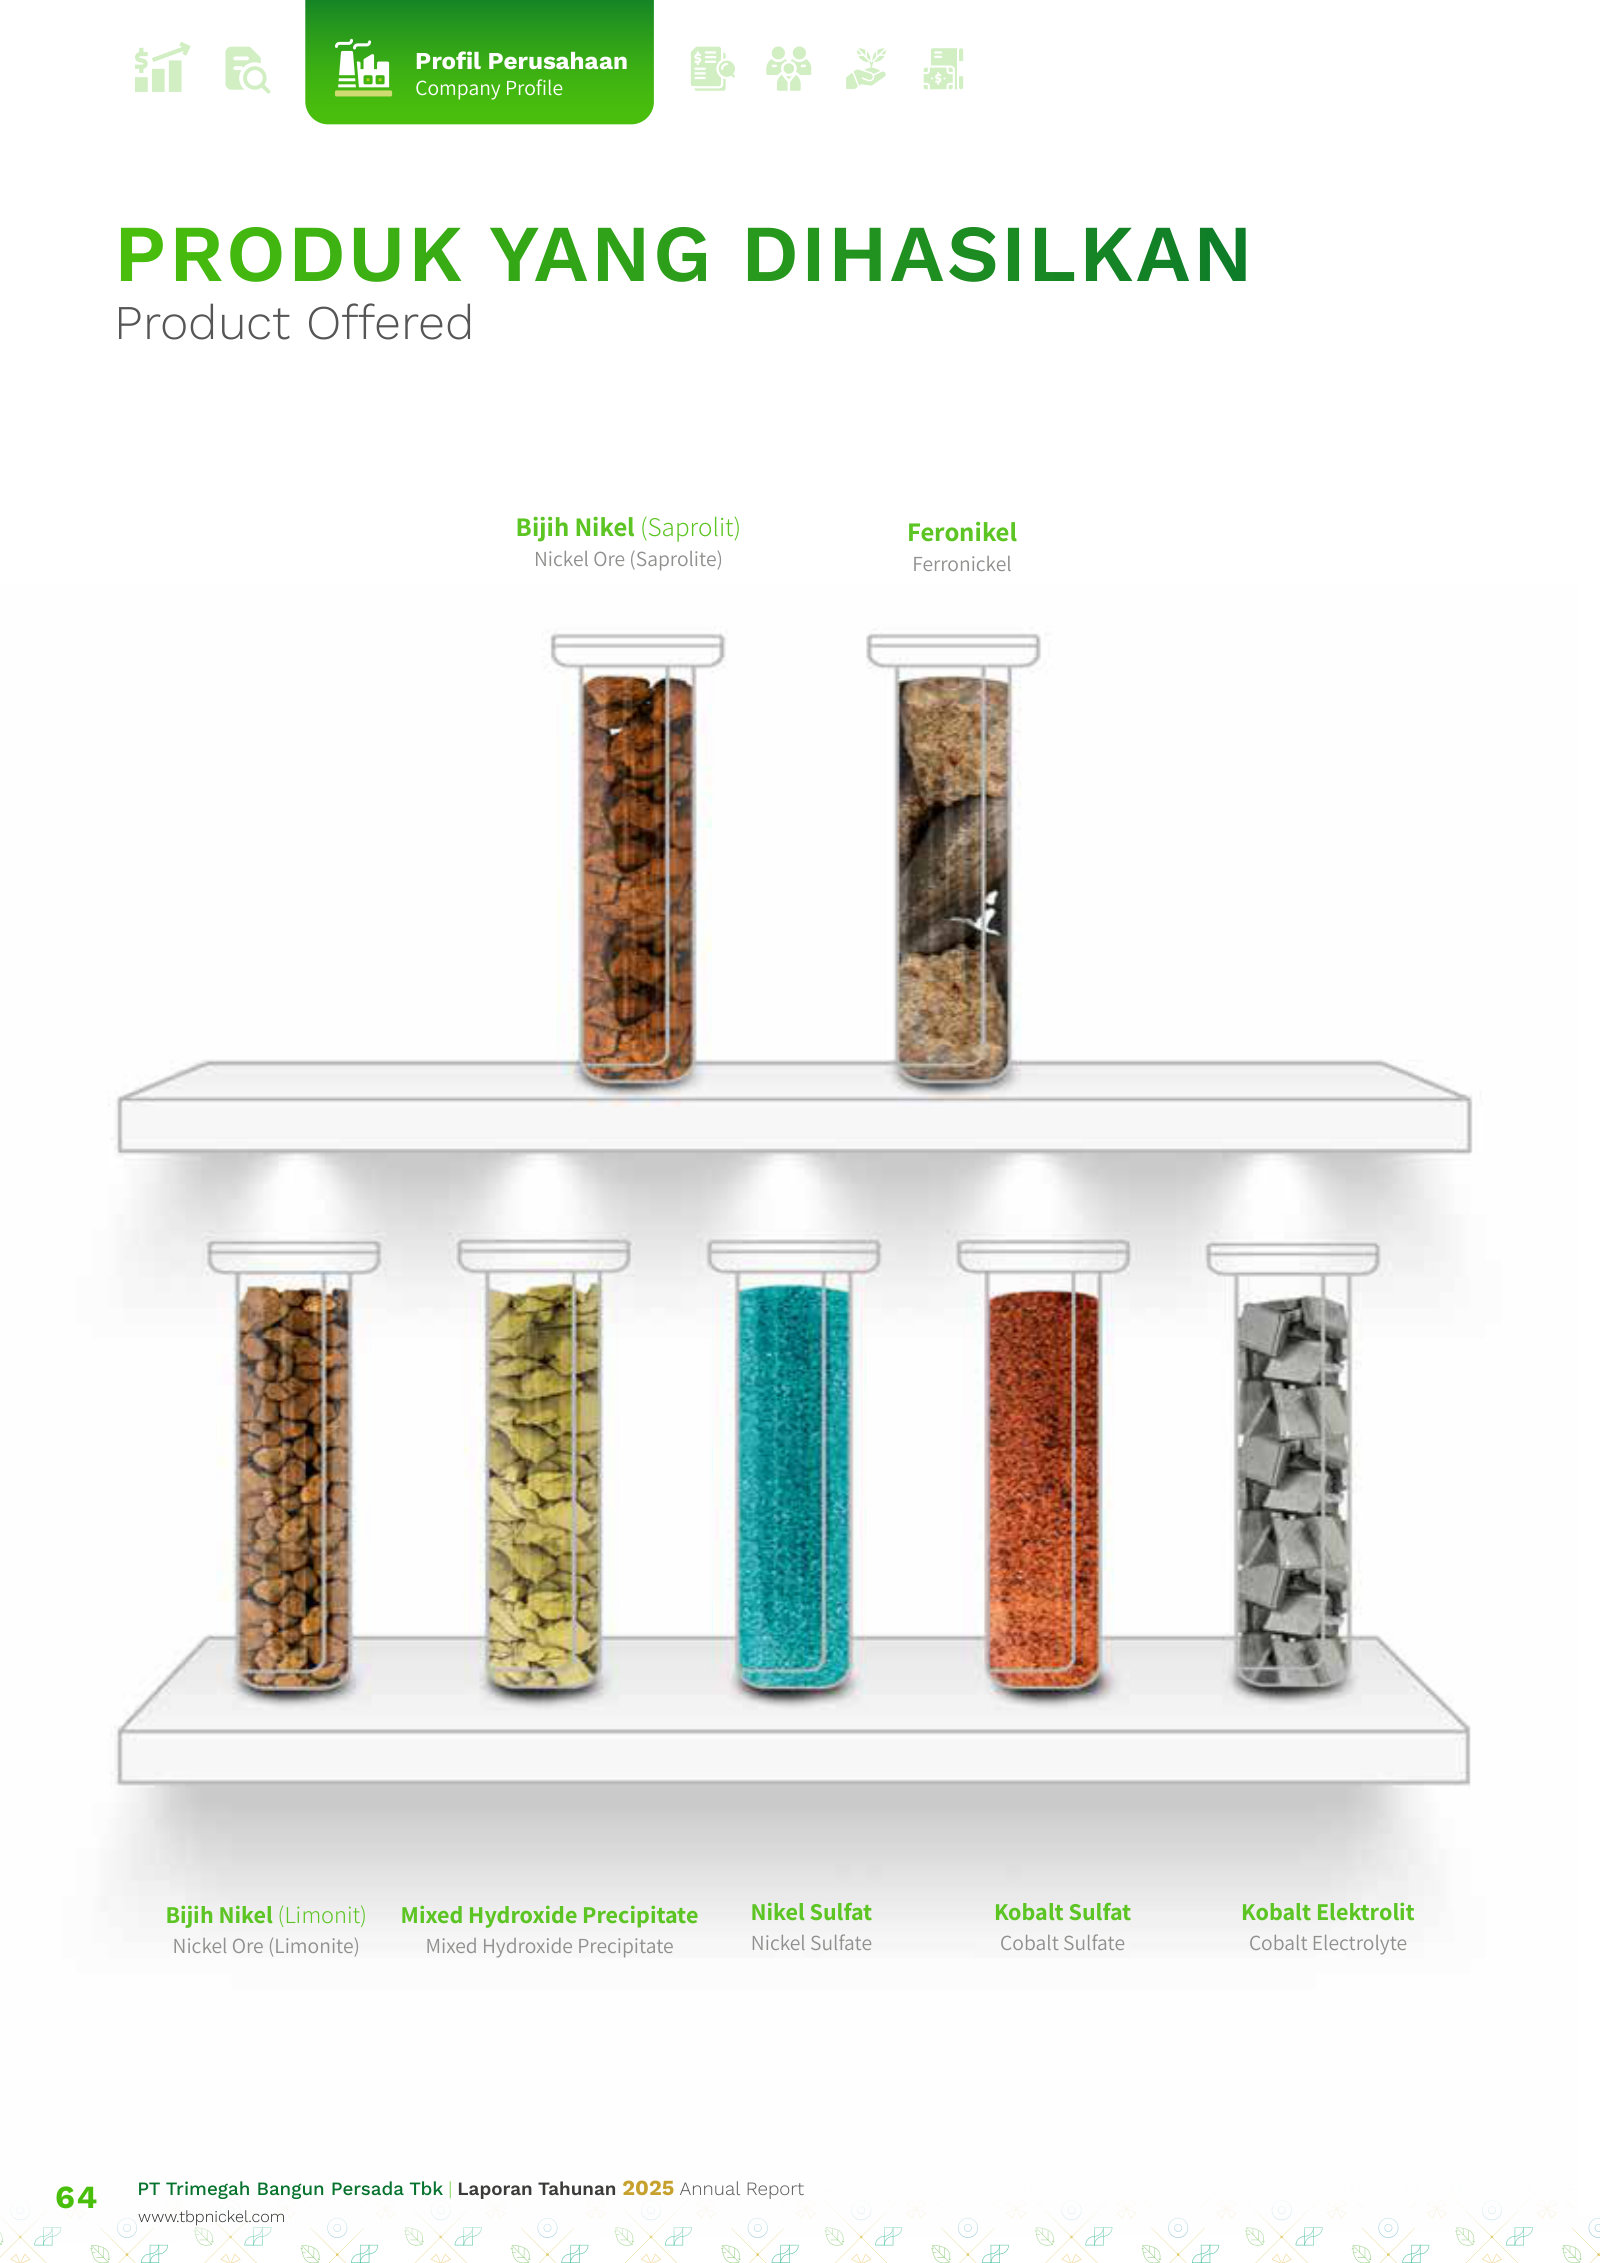
Kegiatan Usaha / Business Activities — p. 64 · Read the full section →
The formal charter scope — nickel ore mining plus industrial estate — and the product ladder the rest of the report builds on.
Perkembangan Industri Nikel Global / Developments in the Global Nickel Industry — p. 106 · Read the full section →
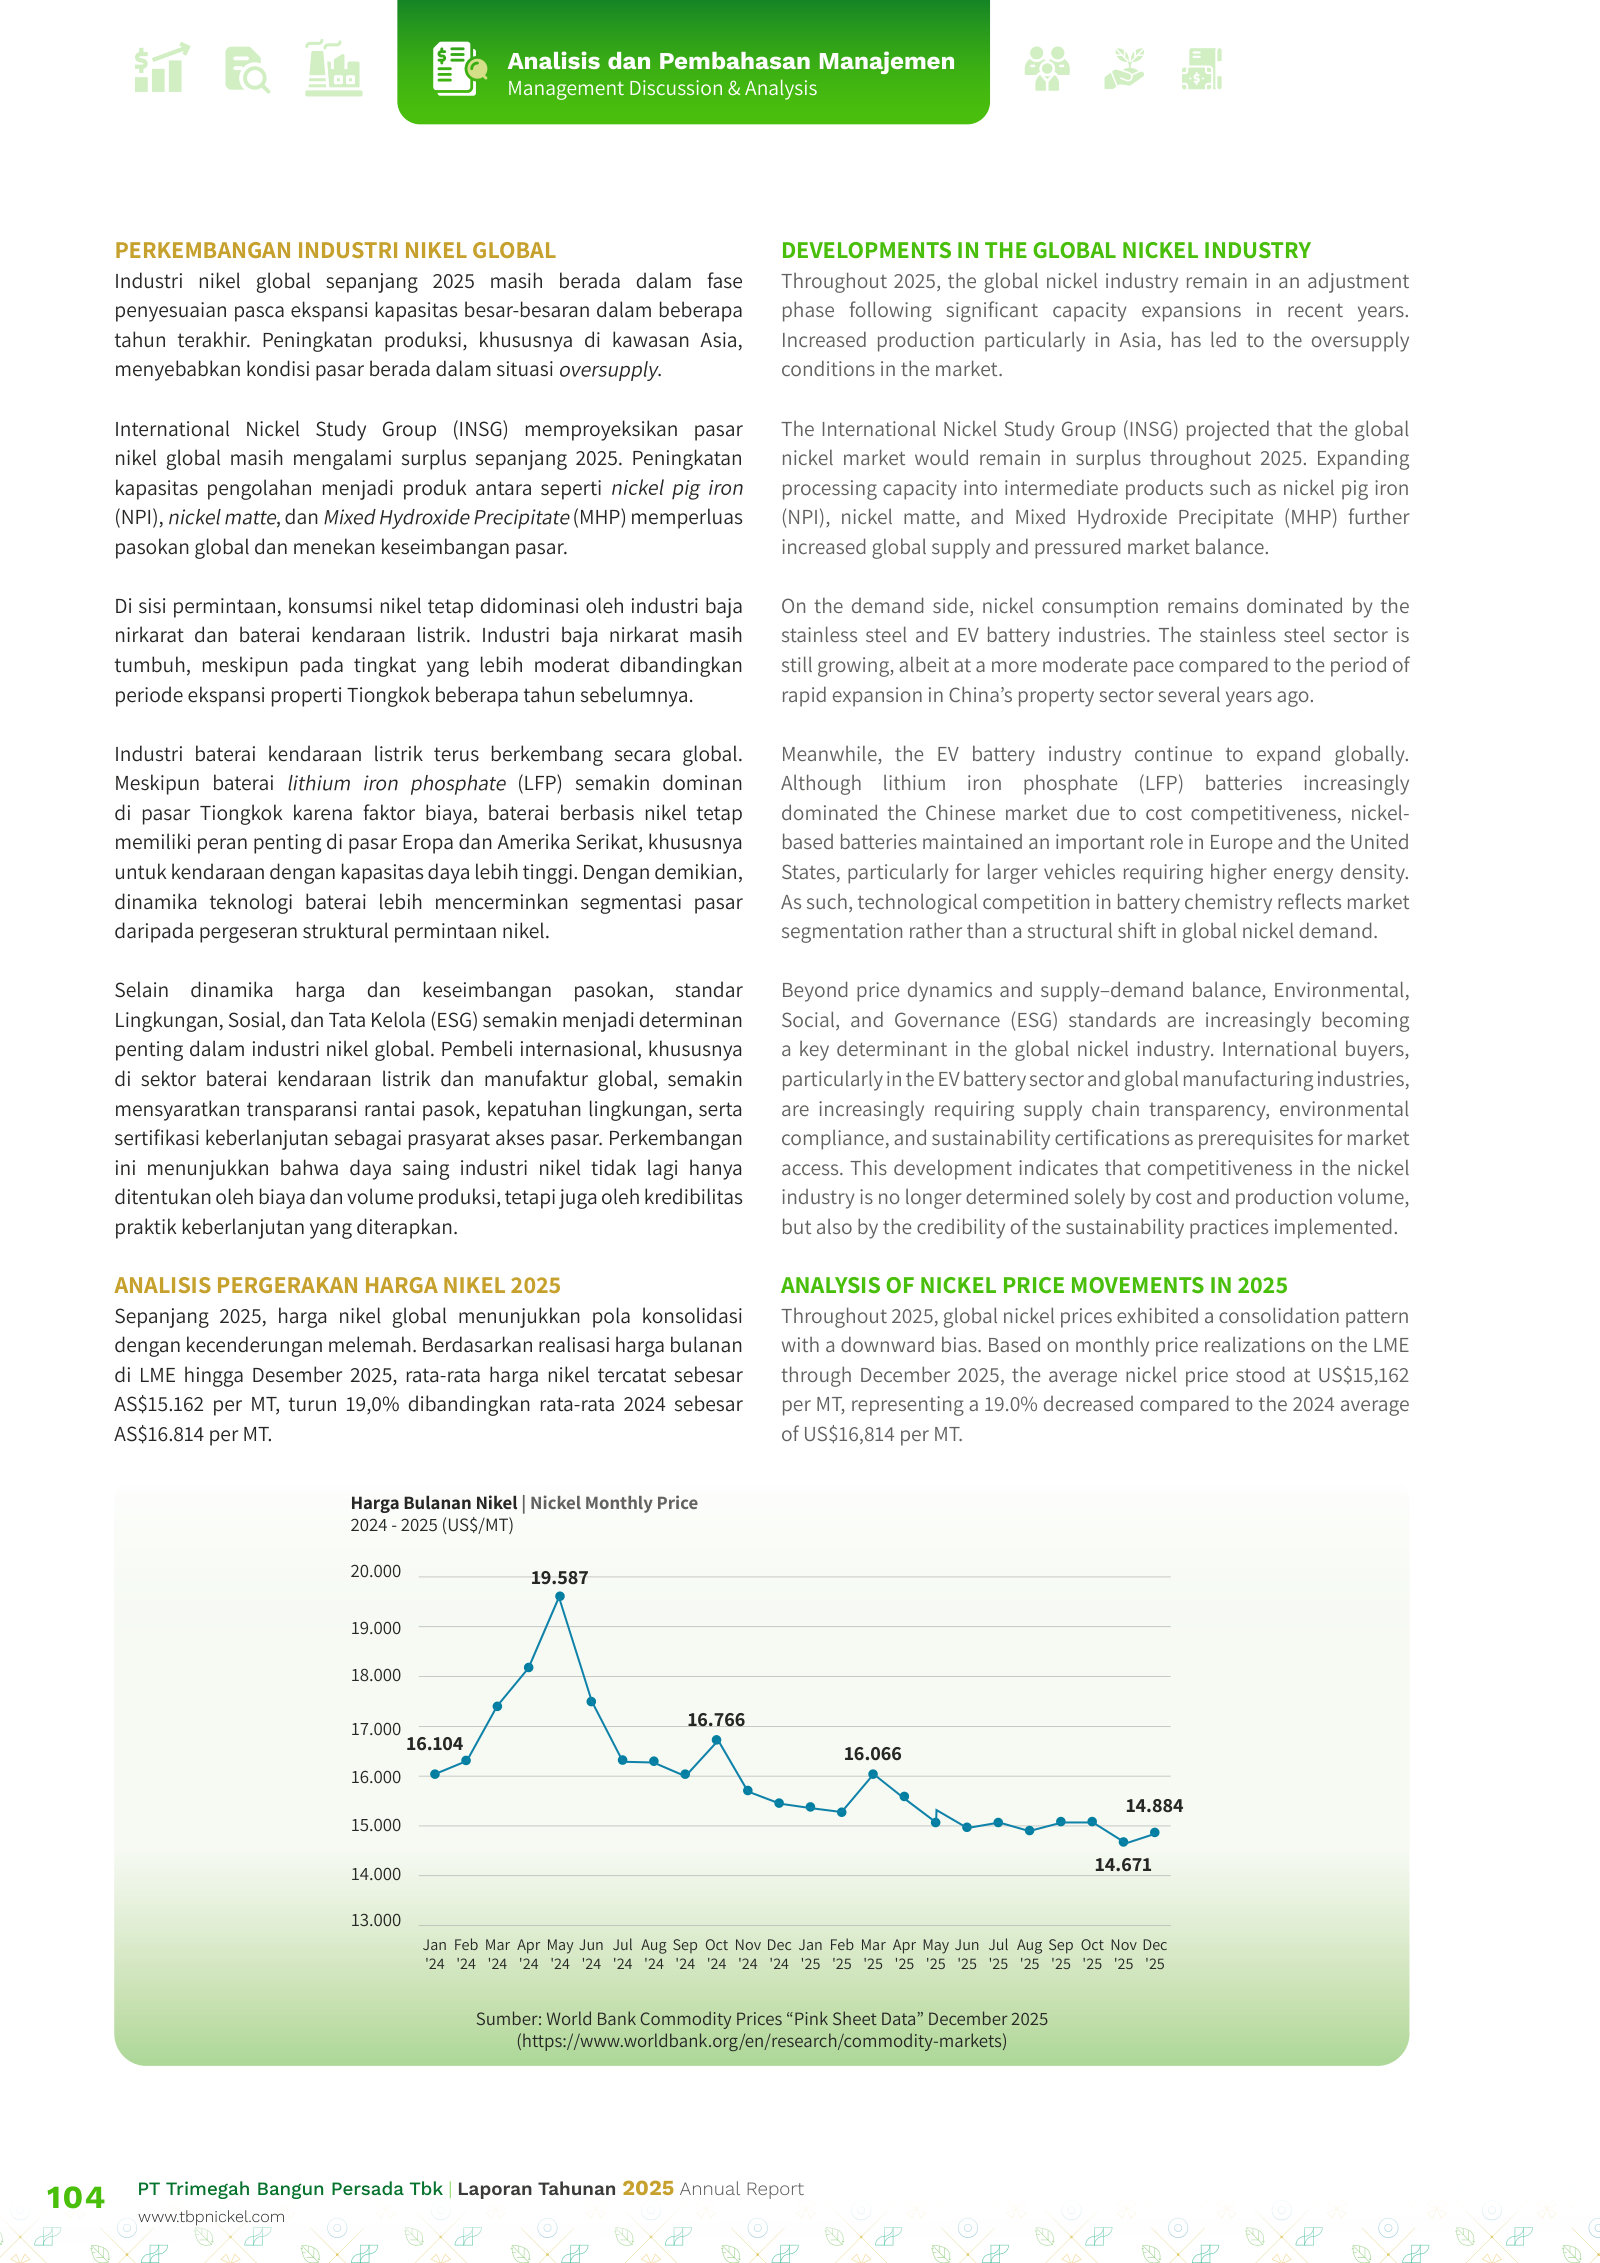
The price cycle that governs this business — 2025 nickel averaged US$15,162/MT, down 19%, on persistent oversupply.
Management's read on the market: oversupply, moderating stainless demand, EV-battery split.
Throughout 2025, the global nickel industry remain in an adjustment phase following significant capacity expansions in recent years. Increased production particularly in Asia, has led to the oversupply conditions in the market. […] On the demand side, nickel consumption remains dominated by the stainless steel and EV battery industries.
p. 106 · Read in context →
Tinjauan Kinerja Operasional / Operational Performance Review — p. 108 · Read the full section →
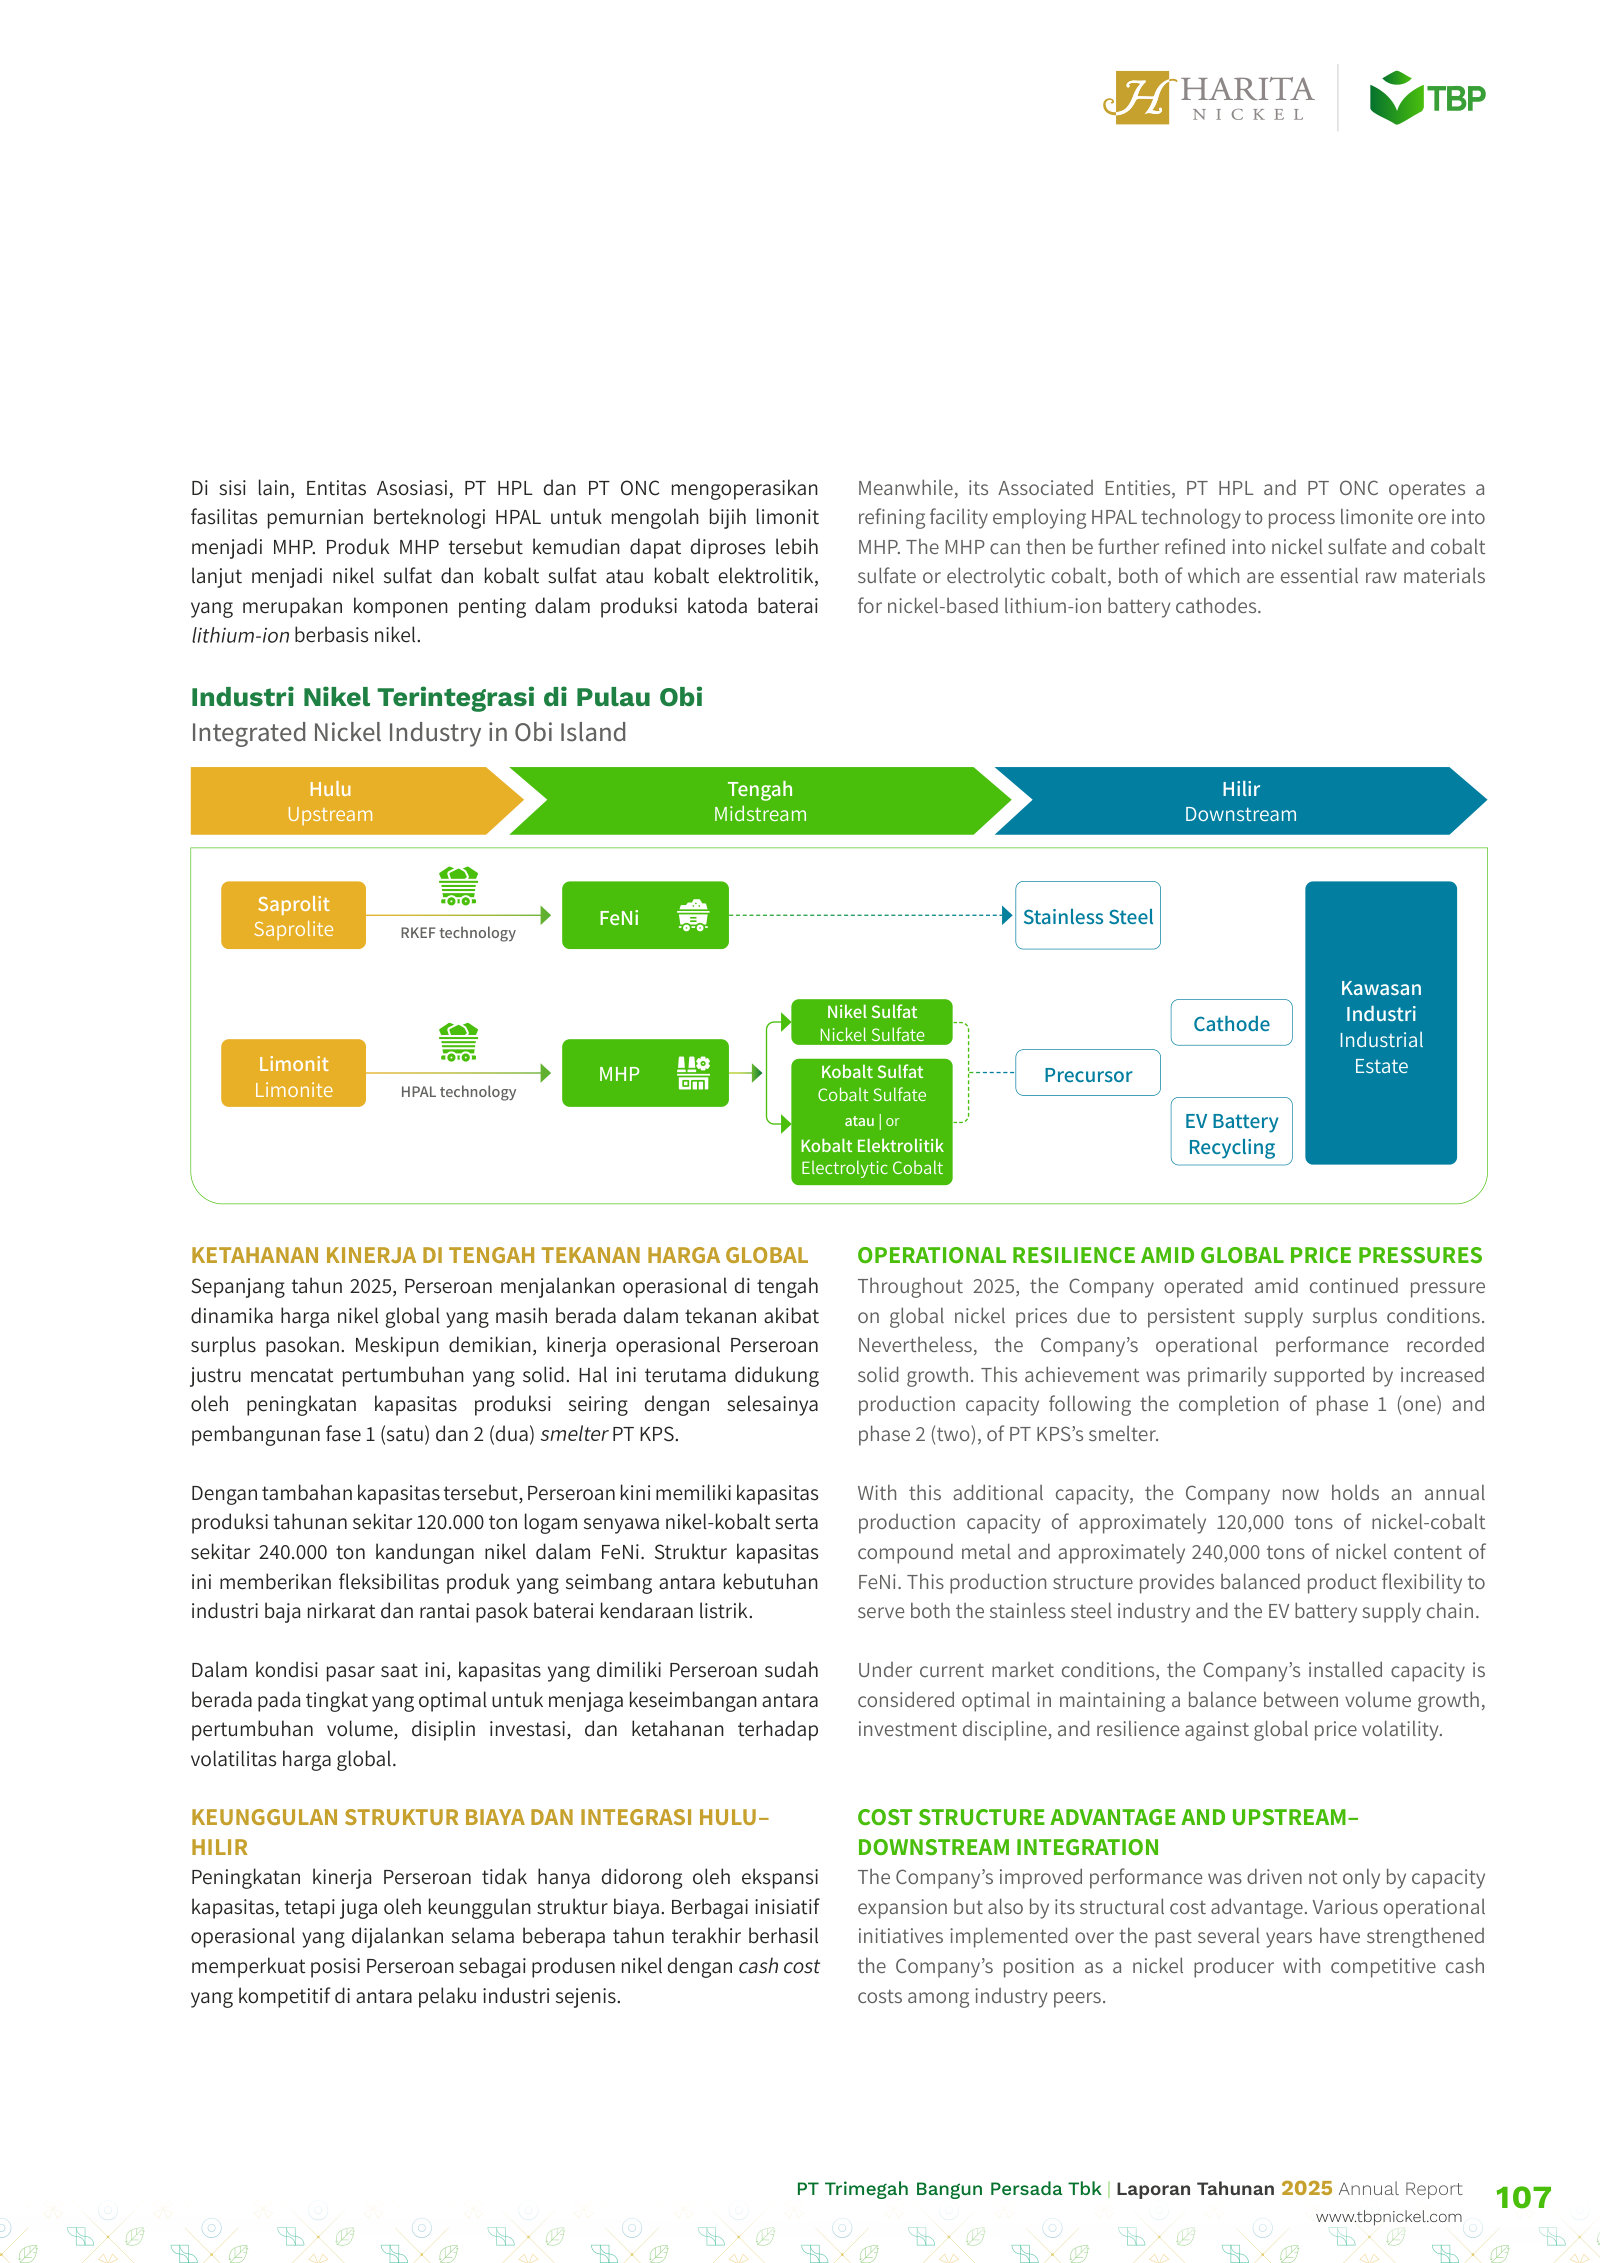
How the business actually works: laterite ore split into two RKEF/HPAL routes, now ~120kt Ni-Co + ~240kt Ni-in-FeNi capacity.
The integrated model — saprolite to ferronickel via RKEF, feeding stainless steel.
The Company operates an integrated nickel business model spanning mining through processing activities. Its primary products are derived from laterite nickel ore, which consists of two main types: limonite and saprolite. […] Through its Subsidiaries, PT MSP, PT HJF, and Associated Entity, PT KPS, the Company operates smelter utilizing Rotary Kiln Electric Furnace (RKEF) technology to process saprolite ore into ferronickel (FeNi), which is subsequently used as a key raw material in stainless steel production.
p. 108 · Read in context →
Tinjauan Keuangan / Financial Overview — p. 118 · Read the full section →
Where management explains the results: revenue +9.9%, mining segment +88.8%, and a doubling of associate profit lifting net income +42%.
Revenue drivers — mining segment nearly doubled while processing dipped 3.1%.
The Company recorded revenue from contracts with customers of IDR29,633 billion in 2025, representing a 9.9% increase compared to IDR26,965 billion in 2024. […] This revenue was contributed by the nickel mining segment amounting to IDR7,178 billion, an increase of 88.8% compared to IDR3,801 billion, meanwhile the nickel processing segment amounting to IDR22,455 billion, a decrease of 3.1% compared to IDR23,164 billion in 2024.
p. 121 · Read in context →
Manajemen Risiko / Risk Management — p. 208 · Read the full section →
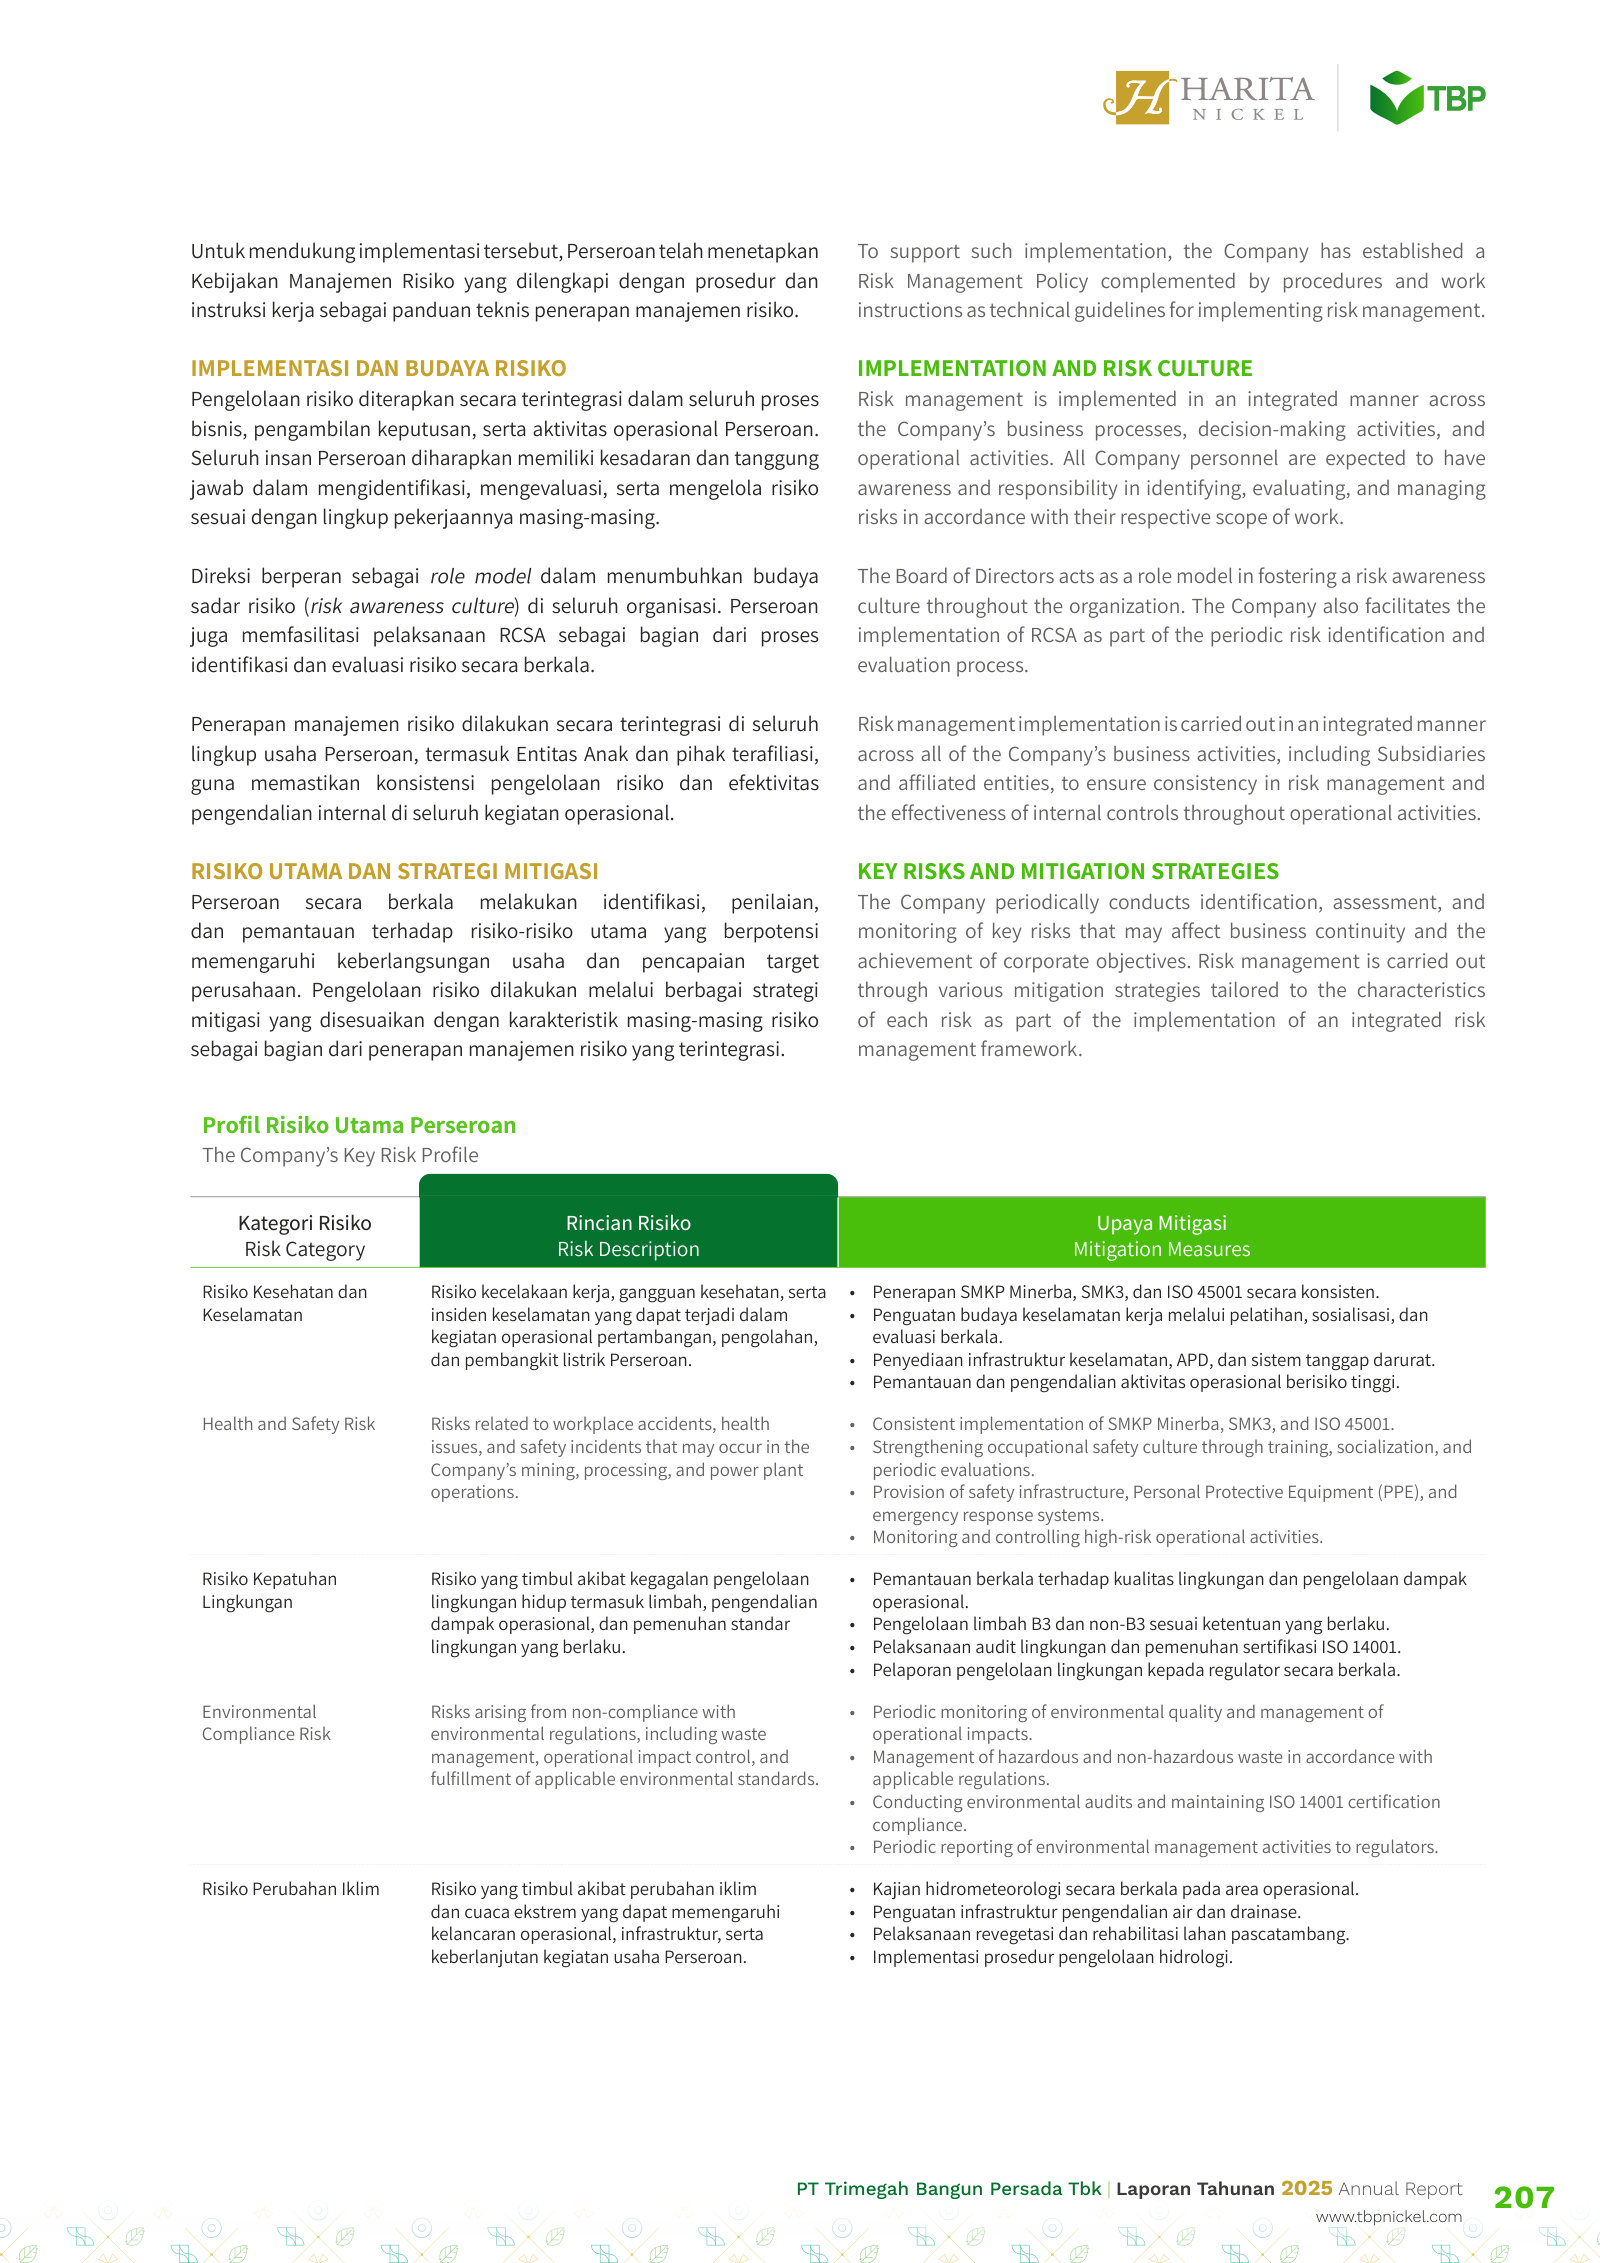
The risks that could bite a single-island miner: environmental compliance, production disruption, and community relations.
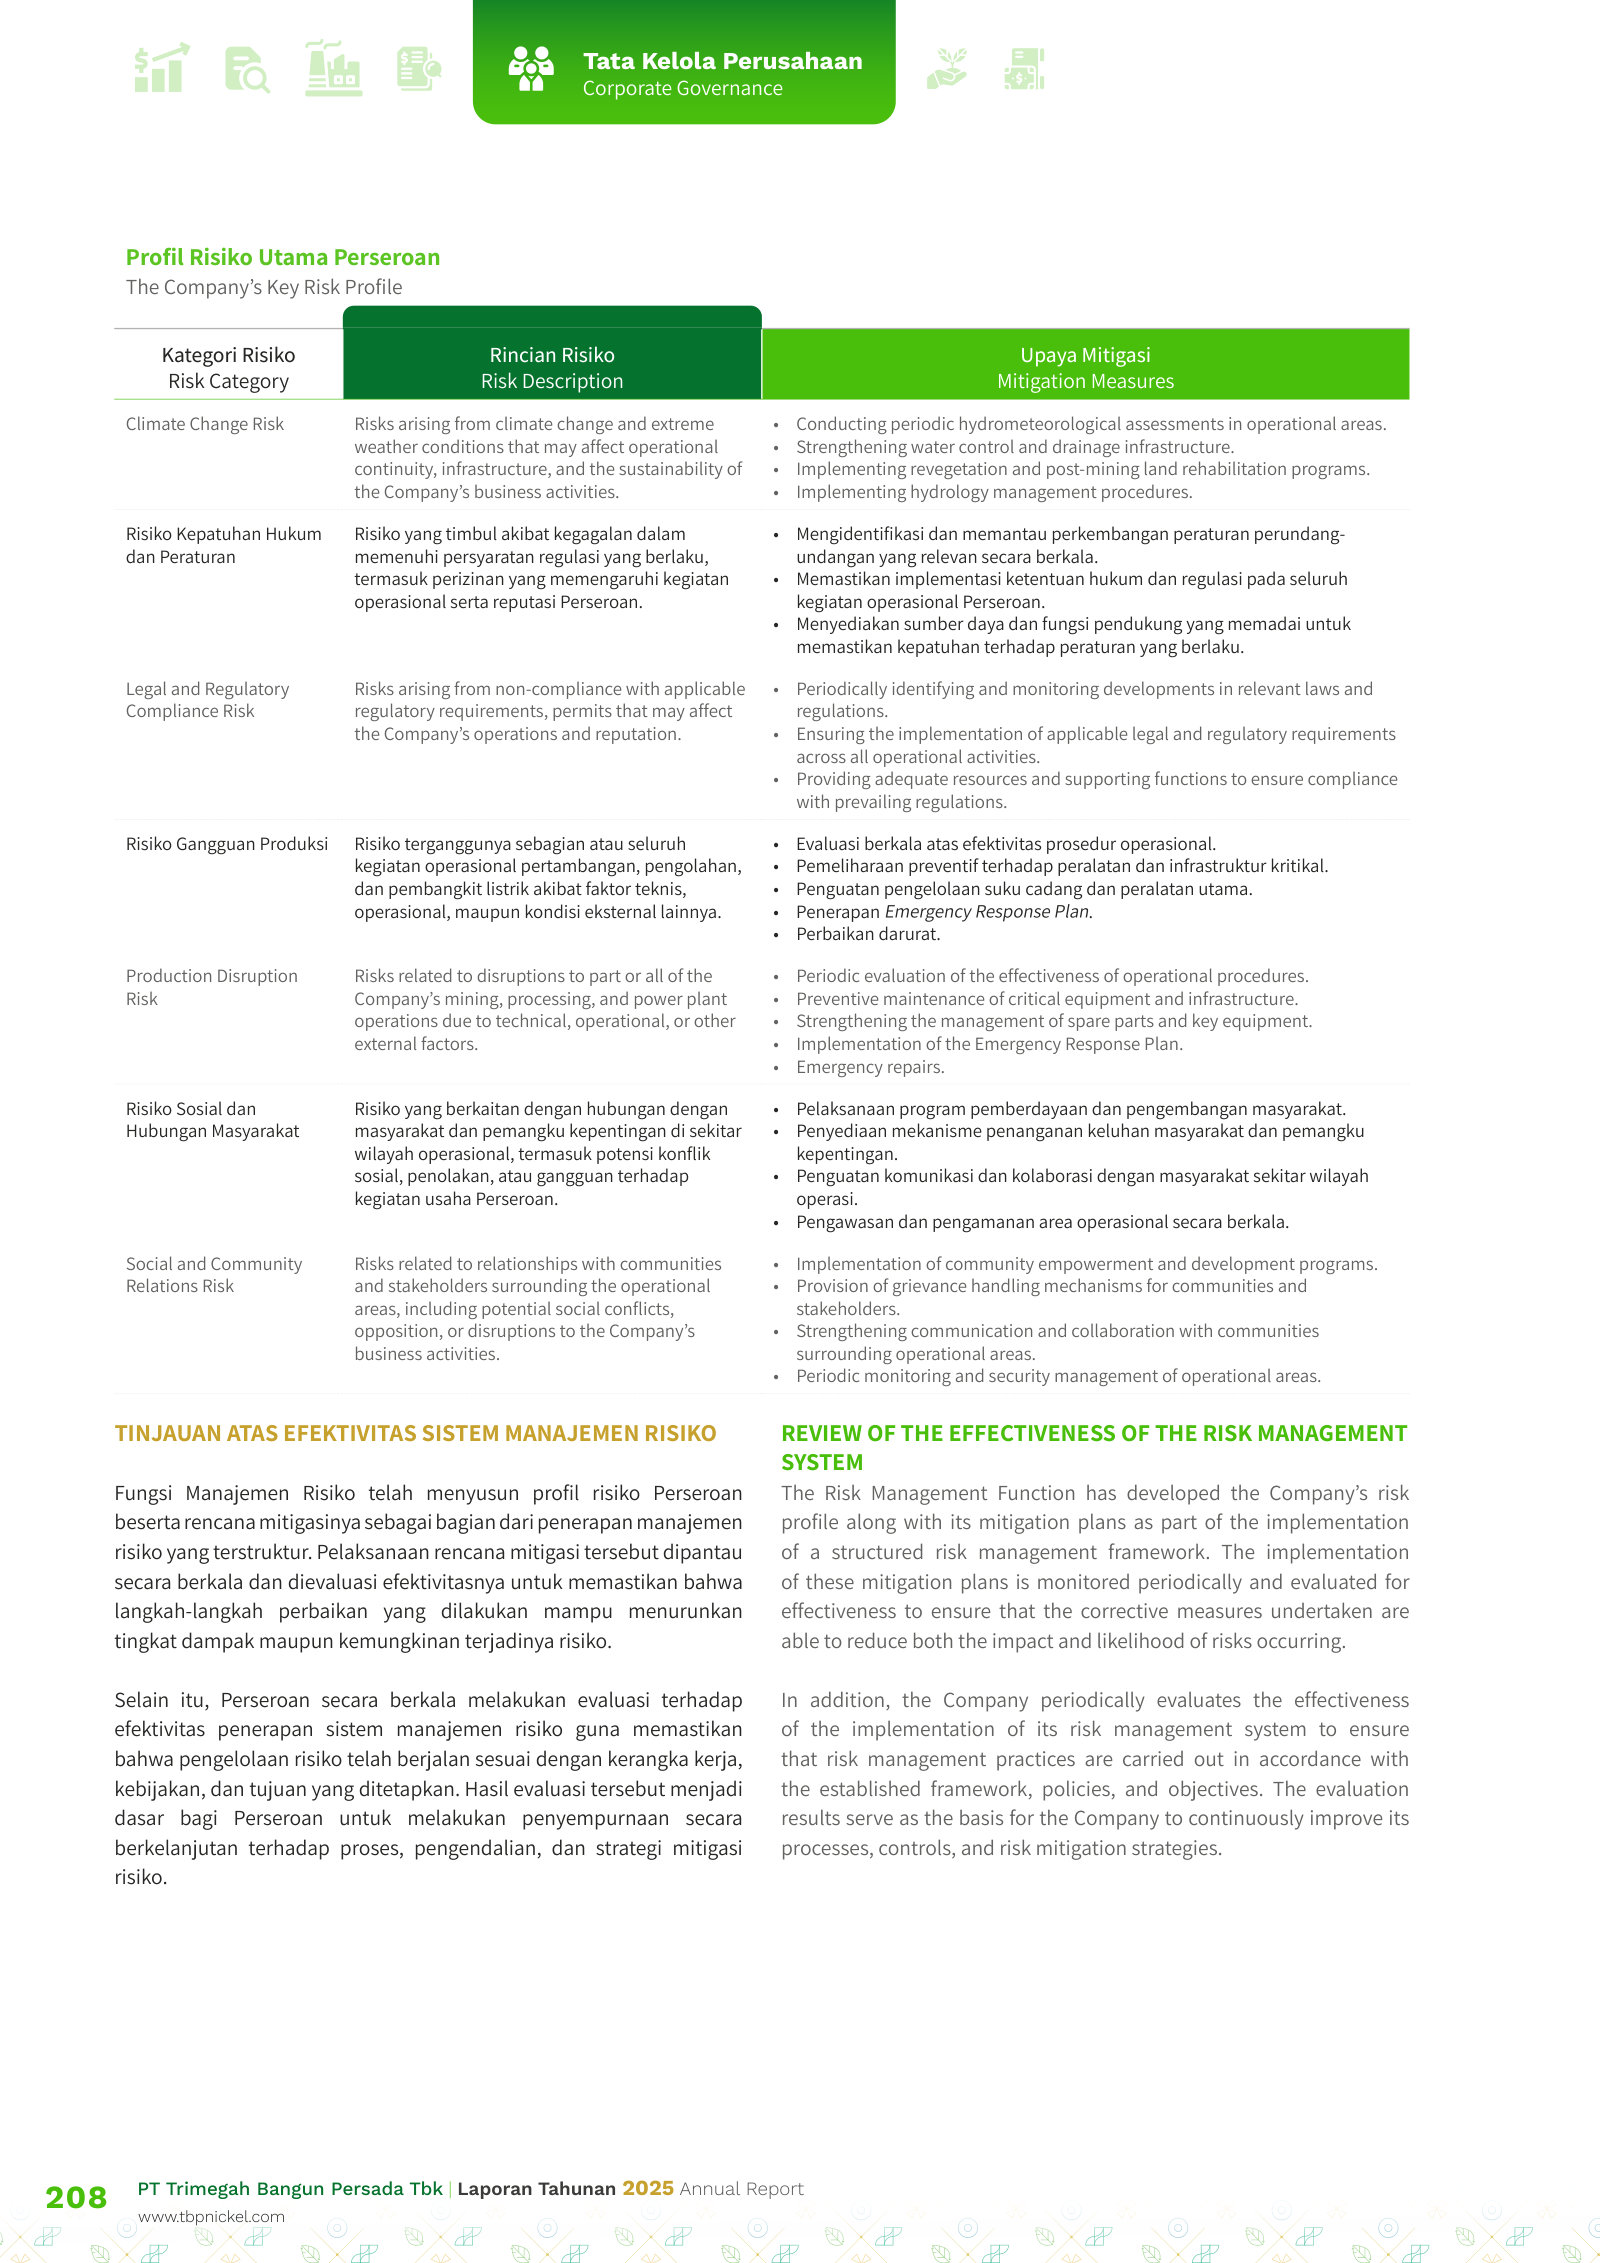
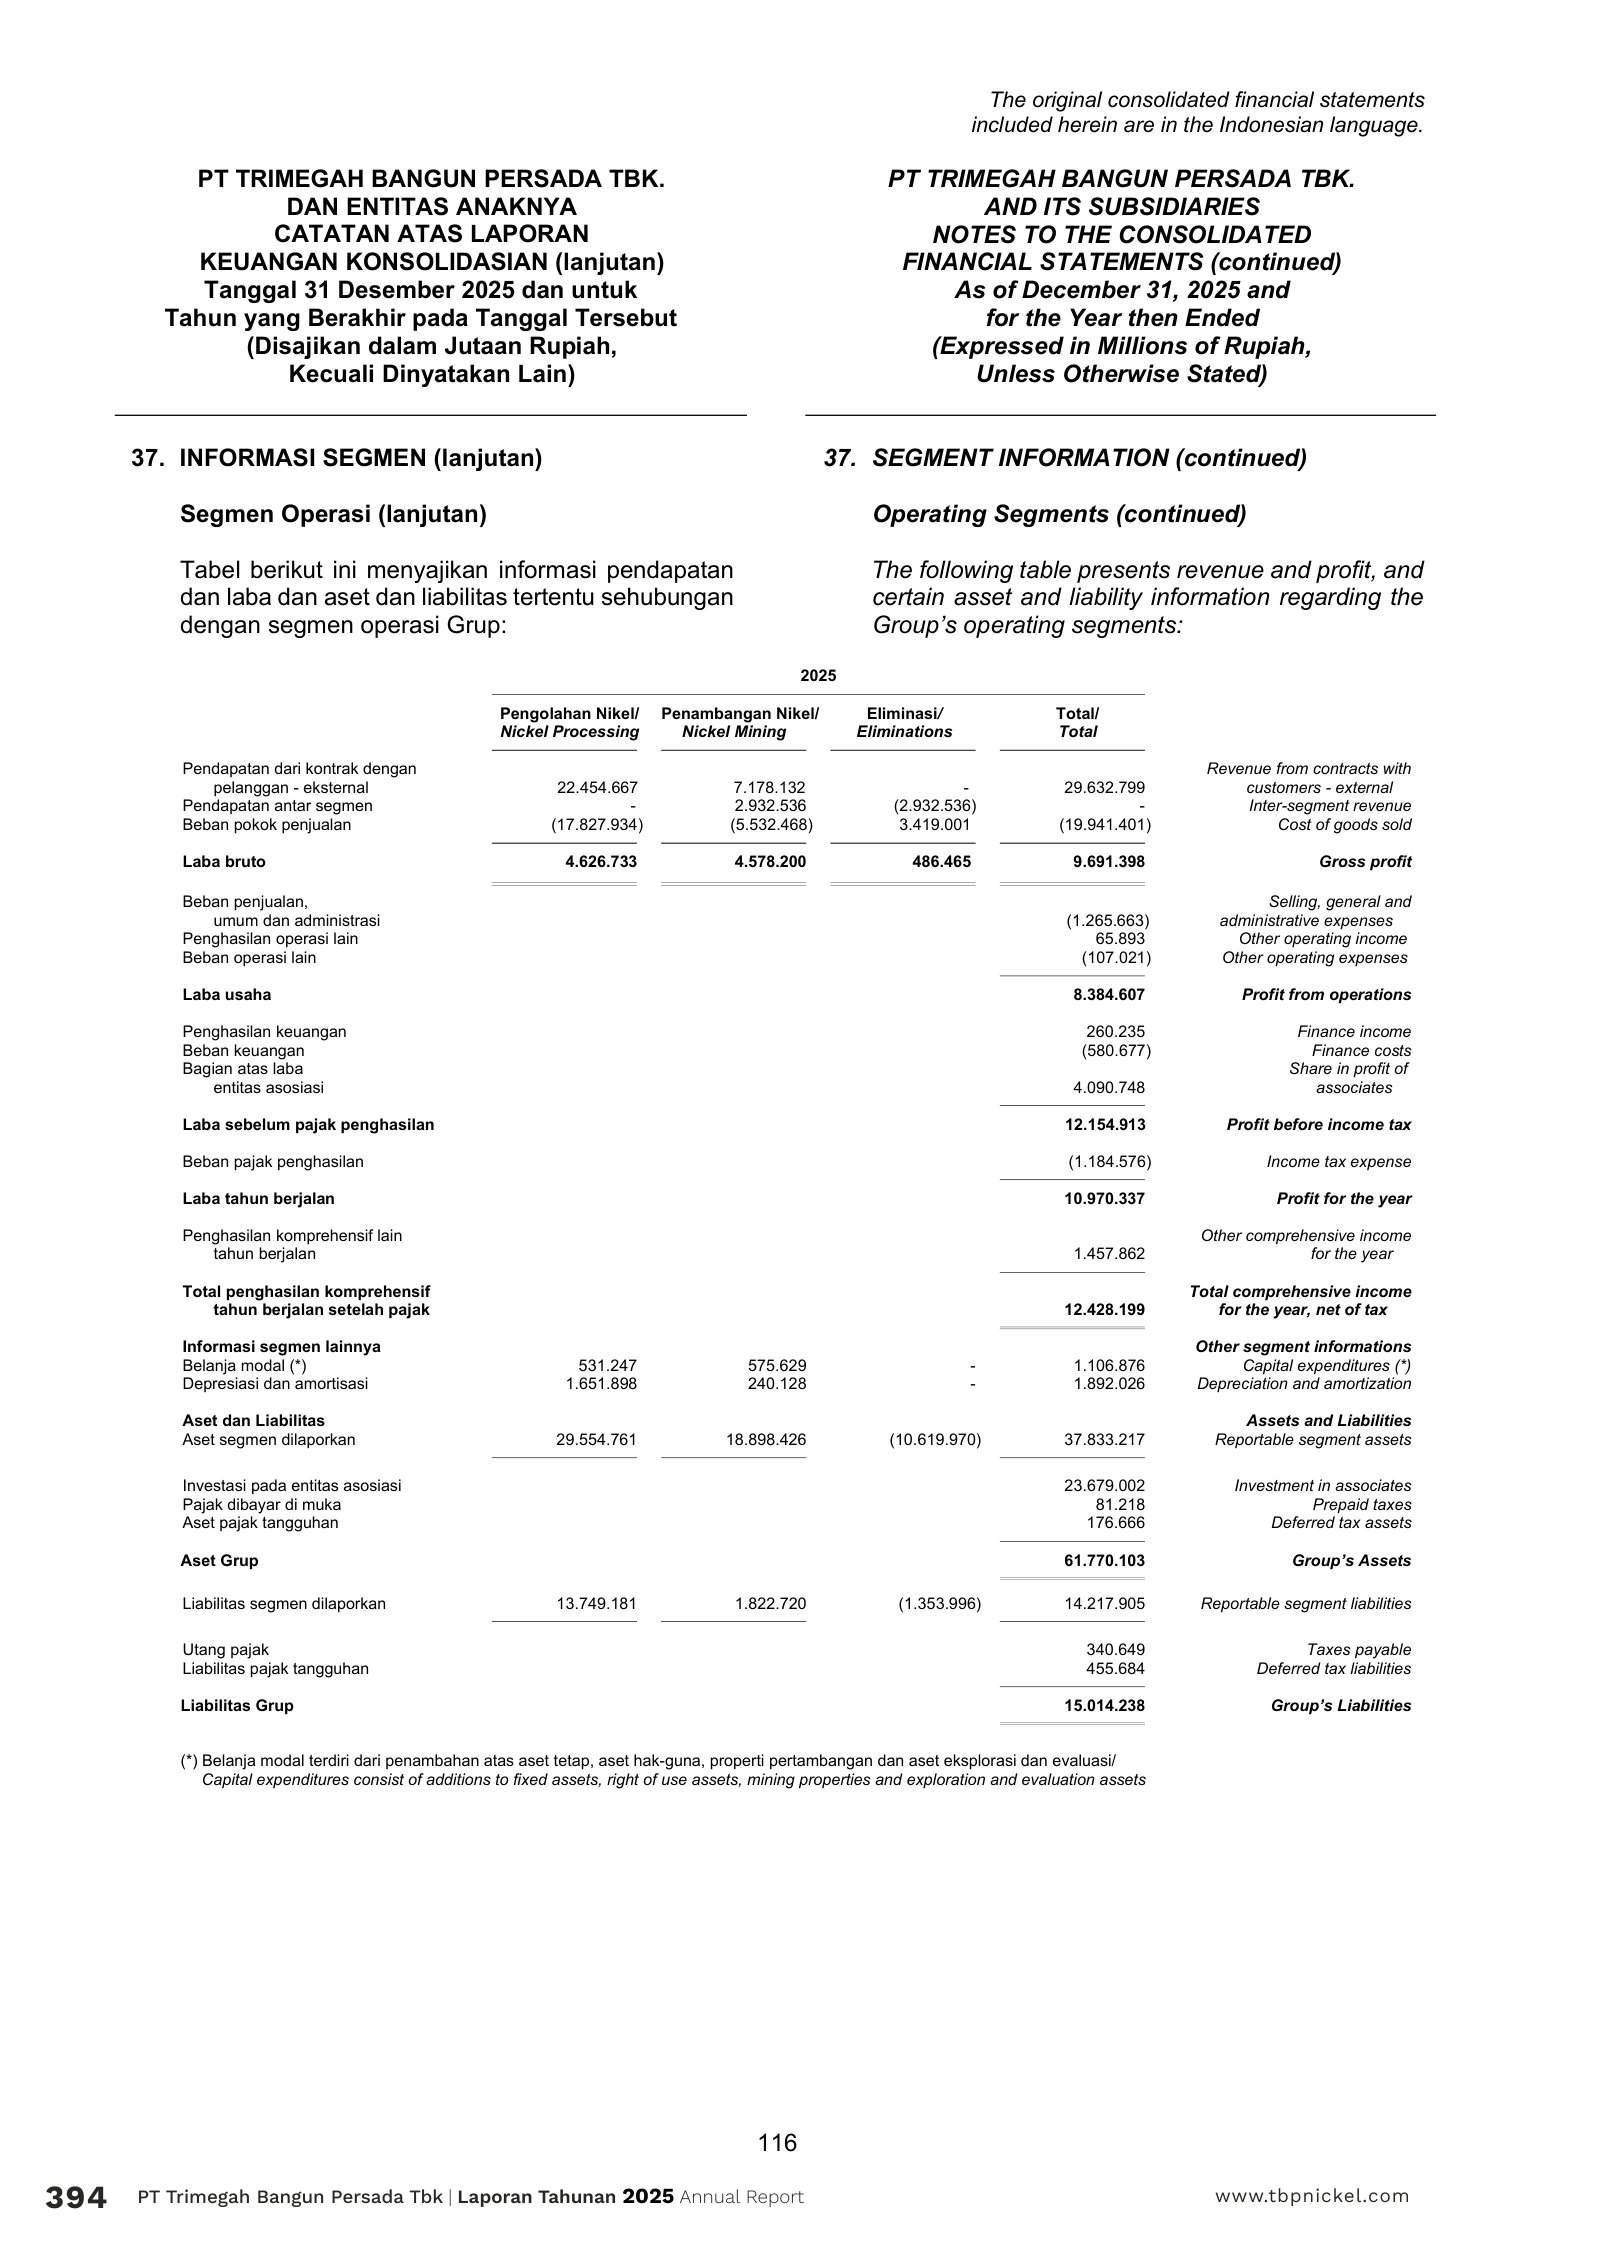
Informasi Segmen / Segment Information (Note 37) — p. 395 · Read the full section →
The audited two-segment split — mining vs. processing — with per-segment gross profit, capex and assets management runs the business by.
The two reportable segments defined: nickel processing (smelter/refinery) and nickel mining (open pit/open cast).
For management purposes, the Group is organized into business units based on their products and services and has two reportable operating segments as follows: […] Segment Nickel Processing is involved in nickel refinery and smelter plant, starting from drying process for reduce water content in nickel ore, smelting, converting and granulation. […] Nickel Mining Segment is involved in open pit and open cast stages which starts from area clearing processing, digging and hauling nickel ore to be taken for preparation to nickel processing plant.
p. 395 · Read in context →
More annual reports
Harita Nickel (PT Trimegah Bangun Persada Tbk) — FY2024 Annual Report — FY2024 · 446 pages · The prior year — the base for 2025's mining-segment surge and the smelter capacity that came online. · Open →
Harita Nickel (PT Trimegah Bangun Persada Tbk) — FY2023 Annual Report — FY2023 · 462 pages · First report as a listed company after the 12 April 2023 IPO — the post-listing baseline. · Open →
Harita Nickel (PT Trimegah Bangun Persada Tbk) — FY2022 Annual Report — FY2022 · 410 pages · The earliest edition — the company as presented around its IPO, before the HPAL/RKEF ramp. · Open →
Competitors describe PT Trimegah Bangun Persada Tbk's market in their own filings and calls. These verified passages and visual pages show where their strategies meet, using source documents preserved in Sources.
Lygend Resources & Technology Co., Ltd. (2245)
Lygend is Harita's actual joint-venture partner on Obi Island, co-owning and operating the HPAL and RKEF plants that are the heart of Harita's downstream business — so its filings name and quantify the subject directly and describe the very same assets.
Lygend's FY2024 report discloses that its Obi HPAL project entity (HPL) paid RMB1.42bn in dividends, of which RMB642m went to non-controlling shareholder PT Trimegah Bangun Persada — the subject — documenting Harita's minority economics in the HPAL plant Lygend operates.
In 2024, HPL distributed dividends of RMB1,423,340,000 to all shareholders, among which included RMB641,926,000 was distributed to a non-controlling shareholder PT Trimegah Bangun Persada ("TBP").
p. 160 · Read in context →
Lygend's own sizing of the Obi Island projects it co-owns with Harita: 120kt/yr of nickel-cobalt compound (MHP) HPAL capacity plus 280kt/yr of ferronickel RKEF capacity — the core downstream assets underpinning the subject.
On the Obi Island, Indonesia, we have jointly invested in two nickel product production projects with our Indonesian Partner, including (i) the HPAL project, a hydrometallurgy project with an aggregate designed production capacity of 120 thousand metal tons of nickel-cobalt compound per annum (including 14.25 thousand metal tons of cobalt), and (ii) the RKEF project, a pyrometallurgy project using the RKEF process (the "RKEF project," together with the HPAL project, the "Obi projects"), with an aggregate designed production capacity of 280 thousand metal tons of ferronickel
p. 4 · Read in context →
Lygend's stated view, citing Wood Mackenzie, that the Obi HPAL project sits at the left end of the global cost curve as one of the lowest cash-cost nickel-cobalt (MHP) producers — a cost claim over the same Obi output central to the subject.
Drawing on the resource synergy advantages of Obi Island in Indonesia and process innovation, according to Wood Mackenzie, the cash cost of the HPAL project remains at the left end of the global cost curve, making our HPAL project one of the nickel-cobalt compound production projects with the lowest cash cost within the industry.
p. 19 · Read in context →
PT Merdeka Battery Materials Tbk (MBMA)
MBMA is Harita's most direct listed Indonesian integrated-nickel competitor — laterite mining plus RKEF/NPI, nickel matte and HPAL/MHP — and its filings size the Indonesian nickel market and stake out the same battery-grade downstream ambition.
MBMA's stated sizing of Indonesia at ~42% of world nickel reserves and ~50% of global output, and its self-positioning as a vertically integrated player across mining, RKEF/NPI and matte — the same value chain the subject spans.
Approximately 42% of the world's nickel reserves are located in Indonesia with its production accounts for around 50% of total global nickel output. The combination of abundant reserves and high production levels provides Indonesia with significant strategic leverage over the global supply chain, ranging from EV batteries to stainless steel. […] The Company has strengthened its position as a key player through a vertically integrated nickel supply chain to optimise opportunities arising from Indonesia's downstream nickel industry. This integration spans from nickel mining at the SCM Mine to NPI processing at RKEF Smelter […] as well as nickel matte production at HNMI as a Class 1 nickel feedstock.
p. 107 · Read in context →
MBMA's claim that its 51%-owned SCM mine is one of the world's largest undeveloped, low-cost, high-grade nickel assets with 25+ years of life — an upstream resource-scale claim to benchmark against the subject's Obi laterite base.
The Company, through its subsidiary MIN, holds a 51% shares in the SCM Mine — a globally significant, high-quality, low-cost mining operation. Located approximately 50 km southwest of IMIP, the mine is known for its substantial nickel resources and highgrade deposits, making it one of the largest undeveloped nickel assets in the world. […] Expected to support more than 25 years of operations, the SCM Mine ofers flexibility in ore extraction to align with downstream processing schedules […] It serves as the cornerstone of MBMA Group downstream value creation.
p. 59 · Read in context →
MBMA management's 2025 outlook citing a projected global oversupply (3.65mt output vs 3.51mt demand) and prioritizing HPAL scale-up for battery-grade nickel — the same MHP niche the subject's HPAL serves.
Industry forecasts for 2025 point to an oversupply, with production projected at 3.65 million metric tonnes against demand of 3.51 million metric tonnes. Despite this, MBMA is well-positioned to navigate these market shifts and capitalise on its vertically integrated operations. Our strategic priorities include scaling up HPAL production to meet the growing demand for batterygrade nickel, expanding downstream processing and continuing advancing innovations that enhance cost eficiency and sustainability.
p. 43 · Read in context →
Nickel Industries Limited (NIC)
Nickel Industries is an ASX-listed Indonesian integrated producer spanning RKEF/NPI, nickel matte and HPAL-derived MHP — the same two-product profile as Harita — and publishes detailed volume, capacity and pricing benchmarks.
Nickel Industries' self-description as a globally significant, low-cost NPI producer that has diversified into nickel matte and HPAL-derived MHP for the EV supply chain — an integrated peer spanning both of the subject's product lines.
Nickel Industries and its controlled entities (together the Group) has become a globally significant, low-cost producer of nickel pig iron (NPI), a key input in the production of stainless steel. Additionally, the Group has diversified into the production of nickel mate and acquired interests in high pressure acid leach (HPAL) projects, producing mixed hydroxide precipitate (MHP) for use in the electric vehicle (EV) supply chain.
p. 4 · Read in context →
PT Harum Energy Tbk (HRUM)
Once a thermal-coal miner, Harum is pivoting into the same integrated Indonesian nickel model as Harita — captive laterite ore feeding RKEF and a new HPAL/MHP plant — giving an outside read on MHP vs RKEF economics and nickel-price dynamics.
Harum's stated per-tonne economics for its two nickel products — MHP materially higher-margin than RKEF/NPI — alongside a planned step-up in captive-ore integration, mirroring the subject's integrated HPAL/MHP model.
The margin improvement was supported by stronger pricing, higher integration and a more favorable product mix, with MHP commencing sales in late March 2026 contributing as a higher-margin product (approximately USD 5,873/t after byproduct credit) compared to RKEF (approximately USD 2,762/t). […] The strong performance highlights the scalability of the nickel segment, with margins expected to remain supported by continued volume growth, increasing MHP contribution, and improved vertical integration, including a projected rise in internal ore production from 13% of ore consumption in 2025 to over 50% in 2026.
p. 2 · Read in context →
Harum's stated HPAL capacity of 67,000 tpa nickel-in-MHP at its BSE project, with a ~80% utilization target for end-2026 — a new Indonesian MHP supply source comparable to the subject's HPAL output.
The BSE HPAL project is progressing well toward its full production capacity of 67,000 tonnes per annum of nickel in MHP. Commercial sales commenced at the end of March 2026, contributing 4,091 tonnes of nickel in MHP. The ramp-up has been completed, with the plant reaching nearly full utilization in April 2026, and the Company is targeting approximately 80% of the 67,000 tonnes capacity by end of 2026.
p. 4 · Read in context →
Harum's read of the 2025 nickel market — soft LME prices (briefly sub-US$15,000/t), elevated US$20–26/t ore premiums, and its ~US$11,225/t blended cash cost — competitive-landscape commentary bearing on the subject's cost position.
The cost of revenue rose in line with higher production, resulting in a blended cash cost of USD 11,225 per nickel tonne, comparable to or slightly lower than USD 11,376 per nickel tonne in 9M 2024. The increase in costs was primarily driven by the ore premium, which remained elevated during the year in the range of USD 20–26 per tonne. […] Despite ongoing pressure on global nickel prices—with LME nickel briefly falling below USD 15,000 per tonne—the Company's nickel ASP remained relatively stable, supported by stable ASP for both NPI and HGNM products.
p. 2 · Read in context →
More peer documents
Lygend Resources — FY2025 annual report — FY2025 · 217 pages · Newest full-year filing; updates the Obi JV dividend to PT Trimegah and refreshes Obi HPAL/RKEF capacity and Indonesian nickel market sizing. · Open →
Lygend Resources — FY2025 results announcement — Q4 FY2025 · 44 pages · Latest results with updated TBP (Harita) dividend distribution and Obi production/market commentary. · Open →
MBMA — Q4 FY2025 quarterly activities report — Q4 FY2025 · 20 pages · Quantifies SCM limonite output feeding multiple third-party HPAL plants — hard ore-supply volumes comparable to Harita's HPAL feed. · Open →
Harum Energy — Q1 FY2025 summary & highlights — Q1 FY2025 · 7 pages · Documents Harum's near-full divestment of its Nickel Industries stake (~USD 78.5m) to refocus — a window into how Indonesian nickel peers are reshuffling ownership. · Open →
Harita Nickel: an integrated producer trading below its listing price
Harita Nickel (IDX: NCKL) is a founder-controlled, integrated Indonesian nickel company that mines ore on Obi Island and processes it into ferronickel and battery-grade material. Since its April 2023 listing, revenue and profit have risen every year — through a nickel-price slump that halved the shares. The stock trades near Rp825, roughly a third below its IPO price, on under six times earnings, while the controlling family sits at 81% and Glencore has bought in. This report examines whether that gap is margin of safety or fair value.
What the company does
PT Trimegah Bangun Persada Tbk — trading as Harita Nickel — runs a single-location, vertically integrated nickel operation on Obi Island in North Maluku, part of the family-owned Harita Group. It listed on the Indonesia Stock Exchange on 12 April 2023 under the ticker NCKL, selling 7,997,600,000 shares at Rp1,250 each and raising roughly Rp10 trillion of primary and secondary proceeds [1].
The business splits into two reportable segments that sit on top of each other:
- Mining digs nickel laterite ore — saprolite (higher-grade) and limonite (lower-grade) — from concessions on Obi Island.
- Processing converts that ore into two product streams. An RKEF (rotary-kiln electric-furnace) route turns saprolite into ferronickel and nickel pig iron for the stainless-steel market; an HPAL (high-pressure acid leach) route turns limonite into mixed hydroxide precipitate and nickel sulfate for the electric-vehicle battery supply chain, with cobalt recovered as a by-product.
Most of the mining segment's ore is consumed internally by the smelters rather than sold to third parties, which is why the processing segment carries the great majority of external revenue and why inter-segment eliminations are large. In FY2024 the processing segment booked Rp23.2 trillion of revenue against the mining segment's Rp8.3 trillion, with Rp4.5 trillion eliminated on internal transfers [2].
Source: FY2024 Annual Report, Note 38 Segment Information [3].
The company sits inside an industry Indonesia dominates. Indonesia holds the world's largest nickel reserves — roughly 72 million tons, about 52% of the global total — and the battery transition is the demand story management sells, even though stainless steel still drove around 70% of nickel demand as recently as 2022 [4]. The strength of that tailwind, and how much of it NCKL actually captures, is a question later chapters take up.
Size and how it earns
Harita Nickel is a mid-cap by global mining standards and a large one by Indonesian nickel standards. FY2025 revenue was Rp29.6 trillion, gross profit Rp9.7 trillion (a ~33% gross margin), and operating profit Rp8.4 trillion [5]. Profit attributable to owners was Rp9.0 trillion, or Rp142.02 per share.
FY2025 Revenue (Rp tn)
Net Profit, owners (Rp tn)
Market Cap (Rp tn)
Trailing P/E
Price / Book
Sources: FY2025 audited financial statements [6]; market cap and multiples derived from the Rp825 close on 14 July 2026 and reported financials.
Revenue nearly tripled in FY2023, from just over Rp8 trillion in FY2021 to Rp23.9 trillion, as the downstream smelters came on line, and has kept climbing since. Profit for the year followed the same path, from a near-breakeven Rp0.1 trillion in the FY2020 price trough to Rp11.0 trillion in FY2025.
Source: FY2019–FY2025 consolidated income statements; FY2025 per the audited statements [7]; earlier years from reported financials and the IPO prospectus.
What makes the recent record unusual is that it was built into a falling price. FY2025 growth was volume-led: ore, ferronickel and HPAL volumes all rose by double digits even as the average LME nickel price fell to about US$15,160 per tonne, down 10% year on year, in what management itself calls a "structural imbalance" between Asian supply and softer demand [8].
One feature of the FY2025 result deserves an early flag, because a later chapter returns to it: Rp4.1 trillion of the Rp12.2 trillion pre-tax profit — about a third — came not from Harita's own operations but from its share in the profit of associates, equity-method income from smelter ventures it does not fully consolidate. That line nearly doubled year on year and is doing more of the heavy lifting than the operating trend alone would suggest [9].
Earnings rose; the price fell
The disconnect that frames this report is between the operating record above and the share price. Earnings per share climbed from Rp5 in the FY2020 trough to Rp142 in FY2025 — and grew 40% in FY2025 alone. The stock did the opposite.
Source: reported basic EPS, FY2019–FY2025; FY2025 (Rp142.02) per the audited statements [10].
Against Rp142 of earnings, the shares closed at Rp825 on 14 July 2026 — about 34% below the Rp1,250 IPO price of April 2023 [11], and roughly 48% below the top of a 52-week range that ran from Rp735 to Rp1,595. That leaves the stock on a trailing price/earnings multiple of about 5.8 and a price/book of about 1.3. Sell-side coverage points the other way: the consensus is a Strong Buy across roughly 13 analysts, with a mean 12-month target near Rp1,570 — some 90% above the current price.
Price, 14 Jul 2026 (Rp)
IPO Price, Apr 2023 (Rp)
52-Week High (Rp)
Consensus Target (Rp)
Source: IPO price per the FY2023 Annual Report [12]; current price, 52-week range and consensus target from market data as reported.
A cheap multiple and a bullish sell-side are not, by themselves, an investment case — a low price can be correct. What it does is locate NCKL squarely in the territory a value or special-situation investor tends to fish: a company the market once prized as a battery-metals growth story, now trading below its listing price and near the bottom of its range, while its reported numbers keep improving.
Ownership and the balance sheet
Two facts anchor the downside case. The first is ownership. The Harita Group's holding vehicle, PT Harita Jayaraya, controlled 81.32% of the shares at the end of 2025, having trimmed from 84.69% a year earlier; the public float is only about 10%. The notable new name on the register is Glencore International Investments, which held 7.19% — a strategic commodity major taking a position while the stock was depressed. The company had also begun buying back a small block of treasury shares [13].
Source: FY2025 audited financial statements, Note 26 Equity [14].
This is a founder-controlled company in the fullest sense: one family holds four-fifths of the equity, so incentives are aligned but minority holders are along for the ride on the family's terms — a governance profile a later chapter examines rather than assumes.
The second fact is the balance sheet, which speaks directly to bankruptcy risk. At the end of 2025 Harita carried Rp46.8 trillion of equity against just Rp15.0 trillion of total liabilities — a ratio near 0.32. Bank borrowings of about Rp9.4 trillion sat against Rp6.0 trillion of cash, for net debt of roughly Rp3.4 trillion [15]. Set against Rp8.4 trillion of operating profit, that leverage is light. And the business throws off cash: operating cash flow was Rp8.6 trillion in FY2025 against capital spending of only about Rp0.6 trillion, as the current build-out phase wound down [16].
Total Equity (Rp tn)
Total Liabilities (Rp tn)
Net Debt (Rp tn)
Operating Cash Flow (Rp tn)
Source: FY2025 audited statement of financial position [17] and statement of cash flows [18].
The pressure is not on the balance sheet; it is on price. The nickel market remains in what management calls a phase of adjustment after years of heavy capacity expansion, and Indonesia's move to tighten ore-mining quotas through the RKAB permitting system — which began to influence market expectations in the fourth quarter of 2025 — is the swing factor for whether the surplus, and the price, begins to correct [19].
What this report tests
The material facts for a cold reader are now on the table: an integrated, single-island nickel producer, 81% owned by its founding family, with rising volumes, a light balance sheet and strong cash generation, trading below its IPO price at under six times earnings while a global nickel glut holds prices down and a third of reported profit flows from associates it does not fully control.
Harita Nickel's low valuation is either a genuine margin of safety — a low-cost, family-controlled, lightly-indebted producer whose output and earnings have kept growing through a severe nickel-price downturn — or a fair price for a business whose end-market is structurally oversupplied and whose reported profit leans increasingly on income from associates it does not fully control. Everything that follows tests one reading or the other.
Financials and Estimates
Harita Nickel's three-year record reads well at the headline: revenue up 24% to Rp29.6tn and EPS up 54% to Rp142.02 across FY2023–FY2025, on a fortress balance sheet with net debt near Rp3.4tn. Beneath it, the source of profit is shifting. Operating margin has compressed from the ~43% of FY2021 to ~28%, and a rising share of pre-tax profit — 34% in FY2025 — now comes from associates the company does not consolidate and whose earnings it funds rather than collects in cash.
The three-year record
The last three years — the window this reader asked to see — show a business still growing volumes into a falling nickel price. Revenue rose each year, gross profit reached a record Rp9.7tn, and operating profit hit Rp8.4tn in FY2025 [1]. Earnings per share climbed from Rp92.39 to Rp142.02 [2].
FY2025 Revenue (Rp tn)
Profit to owners (Rp tn)
EPS (Rp)
Net debt (Rp tn)
Sources: FY2025 Consolidated Statement of Profit or Loss [3] and EPS attribution [4]; net debt derived from the Statement of Financial Position [5].
All figures Rp trillion except EPS (Rp per share). Source: FY2025 statements [6] [7]; FY2023 comparatives from the FY2024 statements [8] [9].
The growth is genuine, and it is volume-led: revenue rose while nickel prices fell, which means Harita sold more metal and ore. But the P&L already carries the tension this report is built around. Gross margin has held in a 31%–35% band, yet operating margin has stepped down and the bottom line increasingly depends on a line that sits below operating profit.
Margins have compressed; the net line has not
The two margins tell different stories. Operating margin fell from the low-40s in FY2021–FY2022 — when a smaller, mining-heavy Harita rode peak nickel prices — to roughly 28% in FY2025 as the downstream processing plants scaled and metal prices dropped [10]. Net margin did not follow it down; it rose to 37% in FY2025, held up by finance costs falling and by associate income roughly doubling.
Source: derived from reported financials, FY2021–FY2025 filings; FY2025 lines per the Statement of Profit or Loss [11]. Net margin is profit for the year over revenue.
The FY2022 net margin spike (48%) reflects large non-operating items in a transition year and is not a run-rate. The steadier signal is the FY2023–FY2025 path: an operating business whose margin has settled in the high-20s, with the reported profit line increasingly propped from below.
A third of pre-tax profit now comes from associates
This is where the financials become company-specific. Harita's share of profit from associates — equity-method income from smelter ventures it holds stakes in but does not consolidate — grew from Rp1.58tn in FY2023 to Rp4.09tn in FY2025, rising from 19% to 34% of pre-tax profit [12] [13]. In FY2025 that line grew 103% while operating profit grew 17%.
"Core" is pre-tax profit excluding the share of associate profit. Source: FY2025 [14] and FY2024 [15] Statements of Profit or Loss.
Two things matter for how a buyer should read the reported multiple. First, associate income is non-cash at the parent: it is Harita's share of the associates' accounting profit, not a dividend received. Second, on net Harita is feeding these ventures more than harvesting them: the associates did remit roughly Rp1.98tn of dividends in FY2025, but Harita invested Rp5.08tn of cash into them that year, up from Rp2.31tn a year earlier, and the carrying value of those stakes rose to Rp23.7tn, now 38% of total assets and nearly the size of its entire fixed-asset base — the fuller treatment of that cash return sits in The Associate Stakes [16] [17]. The FY2025 profit jump is real accounting profit; whether it is worth the same as consolidated cash earnings is the question a later chapter takes up. The counter-view is that the core still grew on its own — consolidated pre-tax profit ex-associates rose from Rp6.60tn to Rp8.06tn over the three years — so this is not a case of a hollow core dressed up by associates, but of a good core plus a fast-growing, cash-absorbing second engine.
A further slice of profit never reaches Harita's own shareholders. Non-controlling interests took Rp2.02tn of the Rp10.97tn FY2025 profit — about 18% — reflecting minority partners in consolidated subsidiaries [18]. Profit attributable to owners, Rp8.95tn, is the figure the EPS and any multiple are built on.
Cash is real, but most of it is exported
The cash statement confirms the operating business converts profit to cash well, then shows where that cash goes. Operating cash flow was Rp8.6tn in FY2025 against capex of only Rp0.58tn — the plants are largely built — for roughly Rp8.0tn of free cash flow before growth investment [19]. Almost all of it was then deployed: Rp5.08tn into associate stakes, Rp2.05tn in dividends to parent and subsidiary shareholders, and a net Rp1.7tn to repay bank debt [20] [21].
Source: FY2025 Consolidated Statement of Cash Flows [22] [23]. Dividends combine parent and subsidiary payments.
The takeaway is not that cash is weak — it is strong. It is that the free cash a value buyer might expect to see returned or banked is instead being recycled into growth that shows up as associate income, not consolidated revenue. Cash balances actually fell slightly over the year, to Rp6.0tn, despite the Rp8.6tn of operating inflow [24].
That deployment sits on a balance sheet built to absorb it. Equity of Rp46.8tn dwarfs total liabilities of Rp15.0tn, and bank debt of about Rp9.4tn against Rp6.0tn of cash leaves net debt near Rp3.4tn — under half a year of operating cash flow [25]. For a reader who wants the chance of insolvency close to zero, the leverage is not the worry; the fuller balance-sheet read sits in The Business.
What the estimates say — and what they don't
Forward coverage is where the public record thins. Harita is followed by about 13 analysts, all rating it Buy, with a mean 12-month target near Rp1,570 (range Rp1,200–Rp1,900) against a price of Rp825 — roughly 90% of implied upside, on consensus. Consensus longer-run growth is put at about 17% a year for earnings and 8% for revenue. But detailed multi-year annual estimate tables are not freely published for this name, so the forward picture below is assembled from the fragments that are, and should be read as indicative rather than precise.
Sources: FY2025 actual per the audited statements [26]; forward figures are broker estimates compiled from public sources (BRI Danareksa, Samuel Sekuritas, Simply Wall St / Investing.com consensus), not from the filings, and dispersion is wide.
The estimates carry a message worth stating plainly. Consensus net-profit forecasts of roughly Rp9.6tn–Rp10.7tn for FY2026 sit at or slightly below the Rp10.97tn Harita just earned, and revenue is expected to be broadly flat as the average selling price stays soft — Q1 2026 already showed revenue down 4% year on year even as net profit jumped 64%, again driven by higher associate income and a raised stake in the Obi Nickel Cobalt (ONC) venture. So the near-term forecasts do not, on their own, describe a company compounding earnings; they describe a flat-to-softer profit year on a weak nickel price. The gap between that and a target 90% above the current price is not closed by the FY2026 estimate — it rests on nickel-price recovery and the continued ramp of the associate ventures, the same two levers that make the reported numbers hard to read. What would change the read: annual consensus that shows consolidated (ex-associate) profit and cash growing, rather than the group total leaning further on equity-method income.
Financials sourced to the FY2025 audited consolidated statements; forward estimates are limited to broker fragments, as detailed multi-year consensus tables are not publicly compiled for this name.
The Associate Stakes
Rp4.09tn — about a third of Harita's Rp12.15tn FY2025 pre-tax profit, and 69% of it by Q1 2026 — is equity-method income from associates it does not consolidate, and the most concentrated stake, ONC (40%-owned), carries ~Rp4.18tn of un-impairment-tested goodwill (~9% of equity) created largely by buying 20% of ONC from the 81%-controlling parent for US$262.9m in June 2025 [1][2][3][4][5][6][7].
Spread across Harita's roughly 63.1 billion shares [8], that goodwill is about Rp66 per share, near 8% of the Rp825 market price, and a full write-down of ONC's goodwill would cost the book about Rp4.18tn [9] — roughly 47% of the Rp8.95tn FY2025 profit attributable to owners [10]. Three facts sit on the other side of the ledger and belong in the same breath: HPL and KPS carry at essentially their share of net assets, with no goodwill to unwind [11]; the ONC price was benchmarked to an independent KJPP appraisal rather than set in the dark [12]; and ONC remitted Rp1.98tn (US$120m) of cash to Harita within the same year, nearly half the purchase price [13]. The earlier reading — that this profit is booked but never collected — turns out to be only half right.
What the associate line actually is
The associates are not a shell. They are Harita's minority interests in three of the largest processing plants of the Obi Island nickel complex: PT Halmahera Persada Lygend (HPL), the flagship HPAL joint venture with China's Ningbo Lygend, in which Harita holds 45.10%; PT Obi Nickel Cobalt (ONC), 40.00%; and PT Karunia Permai Sentosa (KPS), 35.00% [14]. Harita does not control any of them — the stakes sit below 50% and are accounted for by the equity method — which is why their results land on one line, "share in profit of associates," rather than in consolidated revenue [15].
Taken together, these three plants are larger than Harita's own consolidated business. In FY2025 they generated roughly Rp47tn of combined revenue and about Rp11tn of combined net profit, against Harita's own Rp29.6tn of revenue [16][17][18]. Harita's equity-method share of that profit — Rp4.09tn — is a genuine economic claim on operating plants, not a bookkeeping mark against a static asset.
Source: FY2025 and FY2023 audited statements; associate share = share in profit of associates, consolidated = pre-tax profit less that line [19][20].
Both parts grew, but the associate part grew faster. Consolidated pre-tax profit (the plants Harita owns outright) rose from Rp6.60tn in FY2023 to Rp8.06tn in FY2025, up 22% over two years. Associate income rose from Rp1.58tn to Rp4.09tn over the same span, more than doubling in FY2025 alone [21][22]. The FY2025 jump has two drivers: ONC reached commercial operation and Harita doubled its stake from 20% to 40%, lifting its share of ONC's profit from Rp55bn to Rp1.46tn; and KPS swung from a loss to a Rp0.31tn contribution as its own first full production year landed [23].
The correction: this profit is now converting to cash
The earlier chapters flagged a cash worry — that Harita books associate profit but never collects it, pouring capital in while nothing comes back. The FY2025 cash flow statement revises that. Harita received Rp1.98tn of dividends from its associates in FY2025, and Rp1.44tn the year before — a cash line, not an accrual [24].
Source: FY2025 Consolidated Statement of Cash Flows — additions of investment in associates and dividend received from associate [25].
The dividends are documented deal by deal. ONC paid Harita three tranches during FY2025 — US$40m, US$52.0m and US$28.0m, totalling US$120m (Rp1.98tn) [26]. HPL declared a US$200m dividend in December 2024, of which Harita's share was US$90.2m (Rp1.44tn) [27]. Set against Rp4.09tn of associate income booked in FY2025, the Rp1.98tn collected is a conversion of roughly 48% in a single year — partial, but a long way from zero. Over FY2024–FY2025, dividends received of Rp3.42tn recovered about 56% of the Rp6.10tn of associate profit booked across the two years.
That said, the capital flows remain lopsided in the other direction — Harita put Rp5.08tn into associates in FY2025 against the Rp1.98tn it drew out [28]. The distinction that matters is what the Rp5.08tn bought. Most of it, Rp4.25tn, was not funding operating losses; it was the price of acquiring an additional 20% of ONC (discussed below). Operating cash flow of Rp8.60tn covered every rupiah of the associate outflow with room to spare and without new borrowing [29]. This is capital deployed into growth assets that are starting to pay, not a solvency leak.
Where the carrying value is safe, and where it is not
The stakes sit on the balance sheet at Rp23.68tn — 38% of total assets and, in aggregate, the size of Harita's entire owned fixed-asset base [30]. For a business whose largest single asset is a set of minority stakes in private companies, the question a skeptic raises first is whether that Rp23.68tn is impairment-safe at trough nickel prices. The answer separates cleanly by plant.
Source: FY2025 Note 10 — carrying values, effective ownership, and each associate's summarized net assets and results [31][32][33][34].
For HPL and KPS the carrying value tracks Harita's share of the plant's own net assets almost exactly — Rp12.15tn against Rp12.22tn for HPL, Rp2.49tn against Rp2.54tn for KPS [35][36]. There is effectively no premium above tangible net worth, and both plants were profitable through FY2025's low-price year — HPL earned Rp5.11tn, KPS Rp0.89tn — so an impairment would require their net assets themselves to fall, not just a mark to unwind [37][38].
ONC is the exception, and the impairment question is most concentrated at ONC. Its Rp8.56tn carrying value sits about Rp4.18tn above Harita's 40% share of ONC's book net assets (Rp4.38tn) [39]. That Rp4.18tn is goodwill — the premium paid over tangible net worth when Harita bought in — and the company's accounting policy is explicit that goodwill inside an associate is "neither amortized nor tested for impairment individually" [40]. It is only exposed if the entire ONC investment shows an impairment indicator. At roughly Rp4.18tn, that goodwill is about 9% of Harita's Rp46.76tn equity — material enough to matter, small enough not to threaten the business [41].
The governance thread the goodwill sits on
Where that Rp4.18tn premium came from is the sharper point. Harita has been buying more of ONC, and part of it directly from its own controlling shareholder. In December 2024 it bought 10% from Li Yuen Pte Ltd for Rp2.12tn, taking it to 20% and triggering equity-method treatment [42]. Then in June 2025 it acquired a further 20% — for US$262.9m (Rp4.25tn) — from PT Harita Jayaraya, the parent that owns 81% of Harita itself [43].
That is capital flowing from the listed company to its controller, and it is the transaction that created most of the ONC goodwill. Two facts sit on the other side of the ledger, and they belong in the same breath. The June 2025 price works out to the same rate per point Harita had paid the unrelated Li Yuen for the prior 10% of ONC in December 2024 (Rp2.12tn), and an independent appraiser (KJPP Benedictus Darmapuspita and Rekan) valued ONC's fair value at that December date — so the number was benchmarked, not negotiated in the dark [44][45]. And ONC then paid Harita US$120m of dividends within the same year — so the plant Harita bought from its parent immediately returned nearly half its purchase price in cash [46]. The pattern to watch is not this one deal but its repetition: minority holders are along for a series of related-party purchases whose pricing they must trust, even as those same assets prove they can distribute cash.
On the evidence, the associate line is real operating profit that has begun converting to cash (Rp1.98tn of dividends in FY2025), backed by net assets for HPL and KPS. The concentrated risk is ONC's Rp4.18tn of goodwill — about 9% of equity — created by buying from the controlling shareholder and not separately impairment-tested. What would change the read: a sustained stretch of no dividends from the associates, or an ONC impairment, would return this line to the "funded, not collected" concern the earlier reading raised.
One more leak below the line
The associates add profit that Harita does not fully control; a mirror structure subtracts some. FY2025 profit of Rp10.97tn split Rp8.95tn to Harita's own shareholders and Rp2.02tn — 18% — to non-controlling interests in the subsidiaries Harita does consolidate [47]. So the per-share economics are pulled in two directions at once: Harita reaches down into associates for 35–45% of their profit, while minority partners reach up into its subsidiaries for their share. The reported EPS a cold reader sees already nets both. It is a cleaner number than the "share in profit of associates" headline suggests — and a more complex structure than a single integrated miner would carry.
Cost Position
Harita calls itself a low-cost producer in every annual report, but never publishes its own cash cost. The number that actually carries the claim is buried in the segment note: its nickel mining business ran a 45% gross margin in 2025, while its consolidated processing (RKEF ferronickel) earned barely 21% — the same thin conversion economics its listed peers disclose. The cost edge is real and it is upstream, in captive Obi Island ore. It is also shared across the island and defensive rather than pricing-power, which is why it steadies earnings through the downturn without lifting the price.
A claim the filings assert but never quantify
Across four annual reports Harita returns to the same language. It aims "to remain the lowest cash cost producer" [1], and in 2025 frames "cost leadership" as the tool that sustains "its position as a low cost producer" against a pressured nickel price [2]. Management attributes the advantage to upstream–downstream integration on Obi Island, "where mining concessions and processing facilities are located within a single integrated industrial cluster," so that "proximity between mines and smelters reduces logistics costs" [3].
What the filings never give is a figure. Harita describes its cash cost as "competitive… among industry peers" [4] but discloses no dollars-per-tonne, no cost-curve position, and no ranking. Two of its Indonesian peers do publish exactly that. So the claim has to be tested indirectly — through the margins the audited statements do report, and against the peer numbers that are in the open.
Where the margin actually comes from
Harita reports two segments, and the cost advantage lives almost entirely in one of them.
Consolidated operating margin FY2025
Mining segment gross margin FY2025
Processing segment gross margin FY2025
Source: derived from FY2025 audited segment note, Nickel Mining vs Nickel Processing [5].
Source: FY2025 audited segment note (2024 comparative on the facing page) [6] [7].
The mining segment sold Rp10.1tn of ore in 2025 (Rp7.2tn external plus Rp2.9tn to Harita's own smelters) at a Rp4.58tn gross profit — a 45.3% gross margin, down only modestly from 49.7% in 2024 [8]. The processing segment, three times larger by external revenue at Rp22.5tn, earned a Rp4.63tn gross profit — a 20.6% margin [9]. The two segments generated almost the same gross profit in absolute terms.
Source: FY2025 audited segment note (2024 comparative on the facing page) [10] [11].
The reading is direct: mining is a quarter of external revenue but nearly half of gross profit. Harita's cost advantage is a mining cost advantage. It sits on cheap, high-grade laterite it digs itself, and captures the full mine-to-metal margin rather than paying it away to an ore supplier. The ferronickel smelting that sells to stainless-steel mills is, on its own, a commodity conversion business earning a fifth on revenue — no better than a peer that has to buy its feed. What lifts the blended operating margin to 28.3% [12] is that Harita owns both links of the chain. It also explains the earnings resilience the report has already documented: gross margin held near 33% while the nickel price fell about 10% in 2025 [13], because the mining margin is a spread the company controls at both ends.
The benchmark Harita won't print
Two indexed Indonesian peers publish the cash-cost number Harita omits, and they run genuinely comparable models — own mine plus RKEF/NPI smelters. Merdeka Battery (MBMA) reported an average RKEF cash cost of US$9,406 per tonne of nickel in 2025, down from US$10,307 in 2024, against an average selling price of US$11,383 — a cash margin near 17% at the smelter [14]. Harum Energy's nickel unit ran a blended cash cost of US$11,225 per tonne over the first nine months of 2025 [15]. Both sit well below the LME average of roughly US$15,160 per tonne for the year [16] — the whole Indonesian laterite complex is low on the global curve.
Sources: MBMA FY2025 Annual Report [17]; Harum Energy 9M 2025 summary [18].
Harita's 20.6% processing gross margin is squarely in this pack — its smelters are neither visibly cheaper nor dearer than MBMA's. The gap that makes Harita look like a cost leader is not in the furnace; it is the 45% mining margin sitting on top, which a pure smelter simply does not have. That is a fair inference rather than a like-for-like fact, because Harita gives no cash cost of its own — an investor taking the "lowest cash cost" label at face value is trusting a claim the company has chosen not to substantiate with a number.
Durability and exclusivity of the edge
Three things underwrite the mining margin, and each carries a qualification.
Captive high-grade ore, but on a finite clock. Harita mines its own saprolite and limonite on Obi Island — 30.59 million wet tonnes sold in 2025, up 28.8% on the year [19], feeding its own 240,000-tonne RKEF capacity and its associates' HPAL plants. Total reserves and resources stand at 310.8 million wet tonnes [20]. At the 2025 extraction pace that is roughly a decade of runway — and the pace is rising fast, with a further 24% ore-volume increase guided for 2026 as KPS phase 3 starts [21]. The captive-ore edge is real but it is not a multi-decade endowment; it depends on Harita replacing reserves as quickly as it mines them.
The cobalt credit sits in the associates, not here. The lowest-cost, highest-value processing — HPAL turning limonite into MHP with a cobalt by-product, about 14,250 tonnes of contained cobalt a year — runs through PT HPL and PT ONC, which Harita accounts for by the equity method, not in these consolidated margins [22]. The by-product economics that most flatter a nickel cost curve accrue to the associate line the report examines elsewhere (The Associate Stakes), not to the consolidated cost position measured here.
The advantage is shared across the island. Obi Island is not Harita's alone. Lygend Resources — the Ningbo-based partner in Harita's own HPAL joint ventures — describes an "independent industrial park on the Obi Island," using "rich local laterite nickel resources" and integrated logistics "while minimizing operation and production costs" in almost the same terms [23]. MBMA runs the same integrated mine-plus-smelter model in Sulawesi. The location-and-integration playbook that gives Harita its edge over ex-Indonesia producers is the standard operating model of the Indonesian nickel build-out, replicated by well-funded rivals — including Harita's own affiliate on the same island.
The read
The evidence supports a narrow cost moat, not a wide one. It is real: a 45% mining margin, quantified in the audited segment note, that held through a falling nickel price and lifts the consolidated business above the low-teens smelter economics of comparable peers. But it is upstream-specific, shared across the Obi Island cluster and the wider Indonesian low-cost basin, and it runs on a reserve base of about a decade at the current pace. It is a defensive advantage — it lets Harita stay comfortably profitable while higher-cost tonnes elsewhere lose money — not an offensive one: in a structurally oversupplied market the same low-cost flood that protects Harita is what caps the price, so the moat buys survival and steady cash, not pricing power.
Two things would change this read. If Harita began disclosing its own cash cost and it confirmed a durable gap below MBMA and Harum, the moat would earn a wider label. Conversely, because Indonesia's ore reference price tracks the LME, a sustained slide in the nickel price would compress the very mining spread that is the whole advantage — the margin of safety in the cost position is only as wide as the ore price that sets it.
The Nickel Market
Harita sells into a nickel market entering its third straight year of global surplus, and its shares trade near six times earnings, a multiple that discounts continued low nickel prices. The oversupply is real, structural, and largely Indonesia's own doing — which is also the reason Indonesia can throttle it. Demand keeps growing, but the genuine tailwind, battery-grade nickel, reaches Harita mostly through its associates rather than its consolidated smelters.
This is the oversupplied-end-market half of the case — the counterweight to the low-cost position set out in Cost Position. It cannot be settled from Harita's own filings alone, so the reading below triangulates the company's disclosures against three Indonesian and Chinese peers that describe the same market.
A market in surplus
The reference price tells the plainest version of the story. The LME monthly average fell to US$15,162 per tonne in 2025 from US$16,814 in 2024 — a decline of roughly 10%, matching the World Bank's estimate of about a 9% annual drop [1]. Prices peaked near US$16,066 in March 2025, then drifted down under renewed supply pressure to US$14,671 in November before a modest year-end tick to US$14,884 [2].
Source: monthly LME nickel averages as charted in the FY2025 annual report from World Bank Pink Sheet data; several months are read from the filing's chart and are approximate [3].
The cause is not weak demand. The International Nickel Study Group projected the global market would stay in surplus through 2025 as processing capacity for intermediates — nickel pig iron (NPI), nickel matte, and mixed hydroxide precipitate (MHP) — kept expanding faster than consumption [4]. Peer MBMA quantifies the imbalance: it puts the 2026 surplus at about 256,000 tonnes, the third consecutive surplus year, down only slightly from roughly 263,000 tonnes in 2025, with Indonesian NPI output alone near 1.76 million tonnes [5].
Demand is growing, but the mix is shifting
Underneath the surplus, consumption is rising, not falling. The INSG had primary nickel demand growing 4.8% in 2024 and projected a further 5.7% in 2025 [6]. The problem is arithmetic, not direction: supply grew faster.
Where that demand comes from is changing in a way that matters for Harita. Stainless steel still dominates, but its share of nickel demand has slipped from about 70% to 65% over five years, while the battery sector has climbed from 3–4% to roughly 14% [7]. Global EV sales reached 17.1 million units in 2024, up 25%, led by a 40% jump in China [8].
Source: FY2024 Annual Report, Board of Directors’ Report — nickel demand by end-use [9].
Two facts complicate the battery tailwind. First, the demand base is heavily Chinese and heavily stainless: China accounts for about 63.5% of global nickel consumption, and its stainless output — roughly 60% of world production — tracks a property sector that has been weak [10], [11]. Second, the battery-chemistry contest cuts against nickel at the margin: lithium iron phosphate (LFP) cells now dominate China on cost, leaving nickel-rich NMC and NCA chemistries concentrated in Europe and the United States for higher-range vehicles [12]. Harita's own management frames this as "market segmentation rather than a structural shift" in nickel demand [13]; the more cautious reading is that if LFP's share keeps rising, the fastest-growing slice of nickel demand grows more slowly than the EV market itself. Trade policy adds friction on top: US Section 301 tariffs of 100% on Chinese EVs and 25% on EV batteries, and EU tariffs up to 45% on Chinese EVs, threaten the battery supply chain that anchors class-1 nickel demand [14].
Indonesia's supply lever
Most of the glut is manufactured in one country. Indonesia holds close to half the world's nickel reserves and supplies roughly 50% of global production; it produced about 2.2 million tonnes in 2024, the most of any nation [15], [16]. The oversupply, in other words, is not a wave of new mines scattered across the globe; it is Indonesia's own downstreaming build-out. That concentration is what gives Jakarta a lever no other producer nation holds.
That lever is the RKAB, the annual mining-quota system that licenses how much ore each miner may extract. For 2026 the government set the national nickel-ore quota at roughly 260–270 million tonnes, against production of about 364–379 million tonnes in 2025 — a cut of nearly 30%, explicitly aimed at rebalancing supply and steadying prices [17].
Source: FY2025 Annual Report, Nickel Industry Outlook — 2026 RKAB set at ~260–270Mt vs ~364–379Mt in 2025 (chart uses range midpoints) [18].
The quota is not a paper threat. Two peers show it already biting. Nickel Industries reports that Indonesia reverted RKAB approvals from a three-year term back to annual renewal in 2025, and that its own Hengjaya mine sat idle from mid-September until 12 December 2025 while it waited for an extension — no mining at all for nearly three months [19]. A Chinese-listed producer in the corpus records the same policy shift — permits shortened from three years to one — and reads it as an early "signal of marginal tightening" in the market [20].
The market has begun to price the possibility. Harita notes that nickel briefly held around US$16,000 per tonne in early January 2026 on RKAB signals, while cautioning that the move was "sentiment-driven" and had not yet changed a market structure still in surplus [21]. That is the honest shape of the catalyst: a real supply lever with a demonstrated ability to remove ore, set against a government that has widened and narrowed these quotas before, and a surplus that MBMA still expects to persist into 2026 regardless.
Where Harita sits in the market
The tailwinds and headwinds do not land evenly across Harita's business, and this is where the market backdrop connects to the earnings-quality question in The Associate Stakes. Harita's products split cleanly by market — and by where they sit in the group.
Source: Harita product portfolio and processing routes [22]; associate structure per The Associate Stakes.
The consequence is that Harita's consolidated income statement is tilted toward the weaker end of the market. Its RKEF smelters turn saprolite into ferronickel for stainless steel [23] — class-2 metal, sold into the China-and-stainless demand pool that is growing slowly and is most exposed to the surplus. The class-1 battery product, MHP, comes from the HPAL plants, and the largest of those (HPL and ONC) are equity-method associates rather than consolidated subsidiaries. So the structural tailwind the bulls cite — battery-grade nickel — accrues disproportionately to the associate line the report examined earlier, not to the operating profit of the listed entity.
One genuine cross-current runs the other way. The Democratic Republic of Congo's cobalt export restrictions pushed cobalt prices up through 2025 [24], and Harita notes that this cobalt by-product credit helped offset higher sulfur costs and preserve HPAL profitability [25]. That credit, too, lands mostly in the HPAL associates — reinforcing rather than diluting the pattern.
Implications for Harita
The market backdrop is genuinely two-sided, and the evidence does not resolve it into a single direction. On the bearish side: nickel is in a structural, Indonesia-made surplus running into a third year, Harita's consolidated output sells into the slowest-growing (stainless) segment, and the fastest-growing segment (battery) faces LFP substitution and trade barriers. On the bullish side: demand is still growing at 5%-plus, the surplus is shrinking, and Indonesia's RKAB cut is a real lever that has already idled peer mines and lifted spot prices on expectation alone.
The read that best fits the record: the low share price is discounting the surplus, which is real, but the surplus is a policy variable more than a permanent demand shortfall — and Indonesia has both the incentive (price stability, sector governance) and the demonstrated mechanism (RKAB) to shrink it. For a low-cost producer that stays profitable through the trough, as management repeatedly insists it must [26], a tighter quota regime is a call option on rebalancing that the current price largely ignores. The strongest fact against that read is that the quota lever is discretionary and reversible: MBMA still models a surplus in 2026 with the cut assumed, and Jakarta has loosened quotas before when the domestic downstream complex needed feed.
What would move the balance, in falsifiable terms:
- RKAB enforcement. If 2026 ore output lands near the 260–270Mt quota rather than drifting back toward 2025's ~370Mt, the surplus narrows and the mining spread that drives Harita's margin (Cost Position) holds. Slippage in enforcement is the tell to watch.
- The LME reference price. A durable move above roughly US$16,000 per tonne — not a sentiment spike — would confirm rebalancing; a slide back toward US$14,000 would signal the quota is not binding.
- LFP versus nickel chemistry. Continued LFP share gains in the West, not just China, would erode the one segment where nickel demand grows fastest and would weaken the associate-linked battery thesis.
The demand-and-supply picture does not, on its own, make the stock cheap or dear. It establishes that the market's fear is well-founded but not permanent, and that the specific instrument for relief — Indonesian supply policy — is the variable a prospective owner should track most closely. Translating all of this into a value — reserves, capacity, and consolidated cash earnings against the market price — is the work left for a dedicated valuation frame.
Margin of Safety
At Rp825 the market values Harita at roughly Rp52 trillion — about 5.8x trailing earnings and 1.35x book, with net debt near zero. Close to 45% of that price is covered by equity-method stakes that returned Rp1.98tn in cash last year [1]; the rest buys a consolidated business that earned Rp8.4tn of operating profit [2]. The discount is real, but it sits in low leverage and cheap cash earnings, not in a discount to net assets.
What the price is
Share price (Rp)
Market cap (Rp trn)
Trailing P/E (x)
Price / book (x)
Sources: share price per company share-price data as reported (14 Jul 2026); earnings and equity from FY2025 statements [3] [4].
The arithmetic is straightforward. Roughly 63.1 billion shares at Rp825 give a market value near Rp52.1tn [5]. Against FY2025 profit attributable to owners of Rp8.95tn — earnings per share of Rp142.02 [6] — that is about 5.8x. Against Rp38.65tn of equity attributable to owners it is about 1.35x book [7]. A single-digit earnings multiple with near-zero net debt is the starting point every other line in this chapter refines.
A record year met a falling share price
Source: company share-price data, as reported (Jan–Jul 2026).
The de-rating is a 2026 event, and it ran the wrong way against the numbers. The shares peaked near Rp1,540 in February and fell to Rp780 by June before settling at Rp825 — a fall of roughly 47% from the peak in five months, and about a third below the Rp1,250 April-2023 listing price [8]. Over the same stretch the business printed its best year on record.
Source: FY2021–FY2024 per audited income statements; FY2025 per Consolidated Statement of Profit or Loss [9].
Earnings per share have risen every year since 2021 and reached Rp142.02 in FY2025 [10]. What compressed was the multiple, not the profit: at the February high the shares carried roughly 11x trailing earnings; at Rp825 they carry about 5.8x. Analysts covering the stock have not followed the price down — the published consensus is thirteen Buy ratings, no Holds and no Sells, with a mean twelve-month target near Rp1,570, close to 90% above the current level. That gap is the measure of how much pessimism the market has already applied, and a value buyer has to adjudicate it rather than accept it.
What Rp52 trillion buys
The cleanest way to test the price for this business is to separate the two things it owns. Harita is a consolidated mining-and-smelting operation and a set of large minority stakes in the Obi Island HPAL plants it does not control (The Associate Stakes). Those associate stakes are carried at Rp23.68tn [11] — roughly 45% of the entire market value. Net of those stakes at book value, the remainder is the price of the consolidated business.
Source: market value derived from shares outstanding and share price as reported; associate carrying value per Statement of Financial Position [12].
Two facts make the book value of those stakes a reasonable floor rather than a hopeful mark. In FY2025 they earned Rp4.09tn of equity-method income — about a 17% return on the Rp23.68tn carried [13] — and, more to the point for a value buyer, they paid Rp1.98tn of that up to Harita in cash [14]. A stake generating a 17% book return and remitting close to half of it in cash is not obviously worth less than its carrying value.
With the associates held at book, the residual Rp28.4tn is what the market pays for everything else: the mines, the RKEF smelters, Rp22.5tn of fixed assets [15] and the reserve base behind them. That consolidated business generated Rp8.38tn of operating profit in FY2025 [16]. Rp28.4tn for Rp8.38tn of operating profit is about 3.4x. Put differently, whether the whole company is valued on its Rp8.95tn of attributable profit or the consolidated core is valued on the roughly Rp4.9tn it earns without the associates, the multiple lands under 6x either way. The cheapness does not depend on which half you emphasise.
The balance sheet a bankruptcy-averse buyer wants
This reader's binding constraint is that the chance of a permanent loss through insolvency be close to zero. Harita clears that test comfortably.
Net debt (Rp trn)
Net debt / equity
Operating cash flow (Rp trn)
Cash on hand (Rp trn)
Source: FY2025 Statement of Financial Position [17] and Statement of Cash Flows [18].
Bank borrowings of Rp9.38tn against Rp6.02tn of cash leave net debt of about Rp3.36tn [19] — roughly 7% of equity, and well under half a year of operating cash flow, which ran at Rp8.60tn [20]. A business earning through the trough of its own commodity cycle with leverage this light is not one whose equity is priced for survival risk. The margin of safety here is the balance sheet as much as the multiple.
The other side of the discount
The bear reading does not dispute that the stock is cheap on trailing numbers; it disputes what those numbers are made of, and it deserves its best evidence.
Rp4.09tn — about a third of Harita's Rp12.15tn FY2025 pre-tax profit, and 69% of it by Q1 2026 — is equity-method income from associates it does not consolidate, and the most concentrated stake, ONC (40%-owned), carries ~Rp4.18tn of un-impairment-tested goodwill (~9% of equity) created largely by buying 20% of ONC from the 81%-controlling parent for US$262.9m in June 2025. The independent appraisal behind that price, the goodwill test, and the Rp1.98tn the associates actually remitted in cash are set out in The Associate Stakes.
First, the earnings the 5.8x rests on lean on the associates. Their Rp4.09tn contributed 34% of pre-tax profit [21], and Harita put Rp5.08tn of fresh cash into those associates during the year — more than they returned (The Associate Stakes) [22]. Part of that associate profitability also rode a policy-driven cobalt price spike that may not repeat (The Nickel Market). Normalising the associate line raises the whole-company multiple.
Second, the discount is to earnings, not to assets. At 1.35x book, Harita is not a sub-net-asset-value liquidation case; the case rests on cheap, growing cash earnings, which is a different bet from buying good assets below their worth. And the book itself is not conservative everywhere — the Rp23.68tn associate carrying value embeds roughly Rp4.18tn of goodwill on the ONC stake that is not separately impairment-tested (The Associate Stakes), so at sustained trough nickel prices the floor under the sum-of-the-parts is softer than it looks.
Third, cheap is not the same as compounding. Consensus places FY2026–FY2027 net profit at roughly Rp9.6–10.7tn, at or below FY2025's Rp10.97tn, on broadly flat revenue (Financials and Estimates). The 90% implied upside to the consensus target therefore leans on a nickel-price recovery and the associate ramp, not on near-term consolidated growth.
Weighing both sides: at about 5.8x trailing earnings and 1.35x book, with net debt near zero and 45% of the price covered by stakes that pay cash, a good deal of the market's surplus pessimism already looks discounted into the price — the margin of safety is genuine, but it lives in low leverage and a low cash-earnings multiple rather than in a discount to net assets. What would undercut that read is specific and watchable: a durable move in the LME price low enough to push the consolidated RKEF business toward cash breakeven, an associate dividend that does not repeat in FY2026, or a write-down of the ONC goodwill. Absent those, the price is discounting a trough the company has, so far, kept growing through.
Family Control
One family holds about 82% of Harita, and its interests line up with minority holders on the cheap-to-align things: a lean, cash-only, non-dilutive pay bill of Rp51.1bn (about 0.6% of profit), a dividend every share receives equally, and zero equity held by the people who run the company. The alignment that is harder to verify is operational: roughly 22% of revenue and 16% of cost of goods sold pass through Harita-group entities on terms the company states may differ from those with unrelated parties.
Ownership: control at the holding company, none at the desk
Harita is a controlled company in the fullest sense. At the end of 2025, PT Harita Jayaraya held 81.32% of the shares, with a further 0.87% in PT Citra Duta Jaya Makmur, an entity inside the same family control chain that runs up to Lim Gunawan Hariyanto [1] [2]. Glencore appeared on the register during 2025 with 7.19%, and the public free float is 10.44% [3].
That control level rewards a distinction the reader should hold onto: control is not the same as alignment. The family's economic interest is real skin in the game — it is exposed to the same share price and the same dividend as every minority holder. But the alignment runs through the holding company, not through the individuals on the board. Every member of the Board of Directors and the Board of Commissioners owned no shares, directly or indirectly, at the end of 2025 [4] [5]. The executives are professional managers — the president director is a career banker, the finance director a former audit-firm and group-company CFO — not owner-operators [6].
Source: FY2025 Annual Report, Shareholder Information [7].
Two smaller moves are worth noting because they change the control math at the margin. The family reduced its own stake across 2025, from 84.69% at the start of the year to 81.32%, and continued to 79.79% by the end of March 2026 — the mirror image of Glencore's arrival and a modest widening of the float [8] [9]. Neither dents the family's absolute control, but a strategic trader taking 7% is an arm's-length party now sitting alongside minorities.
Pay is lean, in cash, and does not dilute
For a founder-run business, the compensation record is the first place a skeptic looks for extraction. Here it is unusually clean. Total remuneration for both boards was Rp51.1bn in 2025 — Rp42.7bn for the five directors and Rp8.4bn for the three commissioners — up 6.2% from Rp48.1bn in 2024 [10] [11]. Against Rp8.95tn of profit attributable to owners, that entire bill is 0.57% of earnings [12].
Total board pay (Rp m)
As % of owners' profit
Share-based pay
Source: FY2025 Annual Report, remuneration table and audited Note 35–36 [13] [14].
Two features matter more than the size. First, pay is entirely cash — salary, bonus, and benefits in kind — with no stock options or share-based compensation granted in 2025, or in any year since listing [15]. A minority holder's stake is never diluted to pay management. To put the scale in context, the 110.7 million shares Harita repurchased in 2025 cost Rp75.6bn — more than the entire board's annual pay — at an average of Rp682.81 per share [16]. Second, remuneration is set by the general meeting of shareholders, which then delegates the detailed split to the Board of Commissioners; two of the three commissioners are independent [17].
Two disclosure limits qualify the picture rather than overturn it. The company reports pay only in aggregate for each board, declining to break it out by individual on competitive grounds, so no single-executive figure or pay ratio can be checked [18]. And the audited note flags that some key managers also serve as key management of subsidiaries and associates and are paid by those entities too — so the Rp51.1bn is what Harita itself pays, not necessarily the full amount these individuals draw across the group [19].
Dividends: the policy floor, shared pro-rata
The dividend is where family and minority interests visibly coincide. Harita's stated policy is to pay at least 30% of net profit, and it has paid exactly that floor every year since listing: Rp22.189 per share for 2022, Rp26.716 for 2023, and Rp30.357 for 2024 — the last a Rp1,913.9bn distribution paid on 30 June 2025 [20]. The family receives its ~81% of that pool at the same per-share rate as everyone else; there is no special class, no preferential coupon.
Source: FY2025 Annual Report, Dividend and Dividend Policy [21].
The reading is double-edged. Paying the floor and no more means the family, like every holder, leaves roughly 70% of each year's earnings inside the company. That retained capital funds growth — but, as the next two sections show, a large part of it recycles through Harita-group counterparties and back into stakes bought from the parent.
The related-party web
The material governance question at Harita is not pay; it is the volume of business the company does with the family's other entities. In 2025, sales to related parties reached Rp6.58tn, or 22.19% of revenue, up sharply from 14.09% a year earlier [22]. Purchases booked into cost of goods sold ran to Rp3.22tn, or 16.13% of COGS [23]. Nearly a quarter of what Harita sells, and a sixth of what it spends to produce, is transacted inside the family group.
Source: FY2025 audited financial statements, Note 35 [24] [25]. Sales as a share of revenue; purchases as a share of cost of goods sold.
The two sides of that web have different characters. The sales are ore sold by Harita's mining segment to the three processing associates it part-owns — PT Obi Nickel Cobalt (7.86% of revenue), PT Karunia Permai Sentosa (7.58%) and PT Halmahera Persada Lygend (6.75%) [26]. Because Harita owns 40%, 35% and 45.1% of those buyers, value shaded from the mining segment toward an associate is partly recovered through equity income. The purchases are different: they are inputs and services — coal, mining contracting, hauling, shipping, stevedoring and electricity — bought from entities under common family control that Harita does not own at all [27]. Those are a straight outflow to the family vertical, with no offsetting stake.
Source: FY2025 audited financial statements, Note 35, cost of goods sold to related parties [28].
What a minority holder cannot verify is the pricing. The company is candid about the standard it applies: related-party transactions are made "based on terms agreed by the parties, which may differ from those made with unrelated parties" [29]. That is not a claim of arm's-length pricing benchmarked to market; it is a negotiated price between affiliated parties. The filings disclose the volumes and the counterparties in full, but not a margin comparison against third-party terms — so whether the family's captive coal, shipping and contracting are priced fairly to Harita is taken on trust. The company states there were no material conflict-of-interest transactions in 2025 [30].
Buying the associates from the parent
The related-party relationship extends beyond the income statement to the balance sheet, where Harita has repeatedly bought assets from its own parent. The clearest case is Obi Nickel Cobalt, the HPAL plant whose stakes now sit among the associate holdings covered in The Associate Stakes. Harita lifted its ONC stake from 10% to 20% in December 2024 for Rp2.1tn, then bought a further 20% from PT Harita Jayaraya in June 2025 for Rp4.25tn, taking it to 40% [31] [32]. That June purchase is the governance test case, and Harita handled it the way minority protection requires: the price, Rp3,381,837 per share, was set by an appointed independent public appraiser (KJPP) rather than negotiated between affiliates [33]. It is the same pattern as the 2023 purchases of ore-reserve subsidiaries from the parent [34].
The distinction that matters is between the operating flows and the M&A. The large, one-off acquisitions from the parent carry an independent appraisal and OJK affiliated-transaction process; the recurring operating purchases do not carry a disclosed market benchmark. A useful external check exists for at least one associate: Lygend, ONC's other major shareholder, disclosed that ONC paid a US$100m dividend in July 2025 and that US$40m of it went to Harita — confirming both the 40% economic stake and that cash flows out of the associate pro-rata, not selectively [35].
What the evidence supports
On the tests this reader cares about, Harita scores well where alignment is cheap and mixed where it is expensive to verify. The family has genuine skin in the game at ~82%, takes its return through the same dividend and share price as minorities, pays its managers modestly and in cash with no dilution, and priced its largest related-party acquisition off an independent appraisal. The offsetting fact is that a controlled company running ~22% of sales and ~16% of costs through family entities, on admittedly non-arm's-length terms and with pay disclosed only in aggregate, asks minorities to trust a pricing process they cannot audit from the outside.
The read: control here is aligned on the visible economics (dividends, dilution, pay) and unproven on the invisible ones (the fairness of recurring related-party pricing). What would change it in either direction: a disclosed margin comparison between related-party and third-party ore sales or input purchases; a related-party acquisition priced above independent appraisal; or the payout ratio held at the 30% floor while related-party purchases keep growing.
Source: synthesis of FY2025 audited financial statements and Annual Report, Notes 35 and remuneration/affiliated-transaction disclosures [36] [37].
Price Sensitivity
The layer Harita fully owns is its most price-exposed one: consolidated RKEF processing earned a 20.6% gross margin in FY2025 versus 45.3% for captive mining, and when nickel fell in Q1 2026 a 4% revenue dip cut consolidated operating profit 46% to Rp1.05tn — group profit rose only because associate income tripled to 69% of pre-tax profit. [1] [2]
The operating leverage here is severe. Harita's profit has risen every year since 2019 while the nickel price fell 41% from its 2022 peak, and that record reads as resilience — but most of it came from volume filling new smelters, not from earnings that hold up when the price drops. As the build-out matures the volume lever fades. In the first quarter of 2026 the 4% revenue dip drove a 46% fall in operating profit, roughly 11x deleverage, and annualising that consolidated run-rate puts operating profit near half FY2025's Rp8.4tn [3]. Set against the ~3.4x multiple the consolidated business trades on in Margin of Safety, the cheap-looking consolidated business is cheap on a contracting base. This is price sensitivity, not insolvency: mining cash cost near US$1,000 per tonne (a 2022 independent estimate) [4] and net debt near 7% of equity keep the group cash-generative far below today's price (Margin of Safety).
LME Nickel, 2025 Avg (US$/t)
▼ -41% vs 2022
Mining Cash Cost (US$/t Ni, 2022)
Q1 2026 Op. Profit YoY
Associates, % of Q1'26 Pre-tax
Sources: FY2025 Annual Report, global nickel industry review [5]; IPO Prospectus (2023), independent cost-curve estimates [6]; Q1 FY2026 consolidated financial statements [7].
Rising profit through a falling price
The nickel price Harita realises is set on world markets. The London Metal Exchange (LME) benchmark averaged US$25,834 per tonne in 2022, then fell to US$21,521 in 2023, US$16,814 in 2024, and US$15,162 in 2025 — a cumulative 41% decline over three years [8] [9].
Source: FY2025 Annual Report [10] and FY2023 Annual Report [11], World Bank commodity data as cited by the company.
Over the same three years Harita's operating profit rose from Rp3.98tn to Rp8.38tn, and net profit from Rp4.59tn to Rp10.97tn [12]. The engine was volume. Ferronickel (FeNi) sales climbed from 25,302 tonnes of contained nickel in 2022 to 126,344 tonnes in 2024 as new Rotary Kiln Electric Furnace (RKEF) lines came on, and mining volume grew to 23.75 million wet metric tonnes [13]. New tonnes at a lower price out-earned old tonnes at a higher one.
Source: FY2025 audited financial statements, Consolidated Statement of Profit or Loss [14]; prior years from FY2023–FY2024 filings.
The mechanism connecting price to margin runs through Indonesia's ore market. Ore is sold at the government benchmark price (Harga Patokan Mineral, HPM), which is set off the LME nickel price. Peer PT Merdeka Battery Materials (MBMA), which runs the same laterite model, shows the transmission plainly: its saprolite ore realised US$29.1 per wet tonne in 2024 [15] and US$25.7 in 2025 as the benchmark tracked LME lower [16]. Harita's own disclosure carries the same signal for its finished products: in 2023, as LME fell 17%, its realised FeNi price fell 25%, saprolite ore 13%, and cobalt sulfate 70% [17]. Realised prices move at least as much as the benchmark; the growth in profit came despite that, not because prices held.
The cash-cost cushion, by layer
How far the price can fall before a business stops generating cash depends on its cash cost. Harita is integrated across three cost layers, and their cushions are very different. The independent estimates in the IPO prospectus (prepared by consultant AME for 2022) put the mines at roughly US$973–1,092 per tonne of payable nickel — the low end of the second quartile of the global cost curve, and first-quartile within Indonesia [18]. The HPAL refineries that sit in the associates were estimated near US$5,225 per tonne of contained nickel, and the consolidated RKEF ferronickel smelters near US$10,098 [19].
Turned into cash margins on realised prices, the pattern is the point. The last time Harita disclosed unit economics in detail — its first-half-2024 investor deck — mining earned a 62–63% cash margin, the HPAL product (MHP) about 53%, and the consolidated RKEF ferronickel business only 26% (a US$2,923 cash margin on an US$11,294 selling price, over an US$8,371 cash cost) [20].
Source: 1H24 Company Presentation, ASP, Cash Cost and Cash Margin [21].
The cushion is thickest exactly where Harita owns the least — the HPAL associates (The Associate Stakes) — and in the mining segment, and thinnest in the consolidated RKEF smelting that generates the bulk of consolidated revenue. That is the same result reached from a different angle in Cost Position: mining earns a ~45% gross margin against ~21% for RKEF processing [22]. A standalone Indonesian RKEF smelter needs a price near its cash cost to survive: MBMA reported an RKEF cash cost of US$9,406 per tonne in 2025 [23]. Harita's smelters clear that bar because they are fed by captive, near-costless ore — but the thin 26% cushion means the consolidated ferronickel line is the first to feel a further price fall.
On solvency, the layered cost position is reassuring. Mining cash costs near US$1,000 per tonne of nickel mean the upstream business stays cash-generative at almost any plausible nickel price, and net debt is about 7% of equity against Rp8.6tn of operating cash flow (Margin of Safety). A price shock compresses earnings; it does not threaten the balance sheet.
The exposure turned visible in early 2026
Through 2025 the volume lever still worked: full-year gross profit rose 15% even as the LME average slipped another 10% to US$15,162 [24]. The first quarter of 2026 is the first period where the lever ran out. With the major RKEF phases (KPS) already at capacity, volume growth slowed and price weakness came straight through the consolidated P&L.
Source: Q1 FY2026 consolidated statement of profit or loss (with Q1 2025 comparatives) [25].
Revenue slipped 4% on a lower mining selling price, but gross profit fell 35% and operating profit fell 46%, to Rp1.05tn from Rp1.93tn [26]. The consolidated business — mining plus RKEF — behaved exactly as the thin ferronickel cushion predicts once the volume tailwind stops. What kept reported profit rising was the line below operating profit: share of profit of associates jumped to Rp2.15tn from Rp0.64tn, so pre-tax profit still rose 26% and profit to owners rose 64%. In the quarter the consolidated lines Harita controls contracted sharply, while the associate line it accounts for by the equity method surged.
Where the reported profit comes from
That split is not a one-quarter event; it is the direction of travel. Associate income has climbed from 19% of pre-tax profit in 2023 to 23% in 2024 and 34% in 2025 — and to 69% in the first quarter of 2026 [27] [28]. The lower the nickel price grinds, the more the consolidated smelting margin thins and the more the reported result leans on the HPAL associates.
Source: FY2025 audited financial statements [29] and Q1 FY2026 interim statements [30]. Percentages are unitless and identical in both currency versions.
There is a real qualification to read alongside this. Part of the associate surge is a cobalt price spike, not a durable nickel recovery: the Democratic Republic of Congo's 2025 cobalt export restrictions lifted the by-product credit that flows through the HPAL associates (The Nickel Market). If cobalt normalises, the associate line that is currently rescuing group profit would itself soften — so the very cushion offsetting weak nickel is partly leaning on a second commodity that has moved the other way. The associates also remit real cash (Rp1.98tn to Harita in 2025, per The Associate Stakes), so this is a quality-of-earnings concern about durability, not a claim that the profit is fictional.
What would change the read
The judgment here is that Harita's downside is asymmetric: solvency is well protected, but consolidated earnings are highly price-sensitive and that sensitivity is now live rather than hypothetical. The strongest fact against reading this too bearishly is the integrated cost position — mining near US$1,000 per tonne and HPAL near US$5,225 keep two of the three layers deeply cash-positive far below today's price, so a value buyer is not facing a business that stops making money. The strongest fact for taking it seriously is the first quarter of 2026 itself: with volume growth spent, a 4% revenue dip became a 46% fall in operating profit.
Three things would move the read, each checkable in a filing:
The realised ferronickel price against cash cost. Harita stopped publishing unit ASP and cash cost after its 1H24 deck; the FY2025 report and recent decks disclose neither. Restored disclosure — or a further step down in the RKEF gross margin from the ~21% in the segment note [31] — would show whether the consolidated smelter is approaching cash breakeven.
The durability of associate income. Whether the Rp2.15tn first-quarter associate contribution holds through 2026, or fades as the DRC cobalt effect passes, decides how much of the group's earnings power is really Harita's to keep.
The mining benchmark floor. Because ore is priced off the LME-linked HPM, the mining margin compresses with the metal. Whether Indonesia's benchmark holds a policy floor at trough prices — as a tighter ore-quota regime might imply (The Nickel Market) — sets how deep the cushion in the upstream layer really is.
The honest limit on all three is disclosure: Harita reports no group cash cost, no price sensitivity, and no segment cash breakeven. The layered picture above is built from a 2022 independent study, a 1H24 deck the company has since discontinued, and peer benchmarks. It is enough to place the exposure; it is not enough to price the exact nickel level at which the consolidated business stops earning.
Scenarios and Watch List
Harita Nickel enters the next stretch as two businesses stapled together: a consolidated mining-and-smelting operation whose earnings now move sharply with the nickel price, and a set of associate stakes whose profit is large, cobalt-boosted, and volatile. Solvency is not at issue: net debt is Rp3.36tn, 7% of equity, against Rp8.6tn of operating cash flow. What the price actually decides is how much profit the group reports, how much of it is the company's own opinion rather than cash, and how much dividend follows.
Net Profit to Owners FY2025 (Rp tn)
Associates % of Pre-tax Profit
Net Debt / Equity
Operating Cash Flow FY2025 (Rp tn)
Sources: FY2025 audited statements — profit to owners and EPS [1]; share of profit of associates [2]; operating cash flow [3]; net debt and gearing [4].
How the pieces fit
Across FY2025 the group earned Rp29.6tn of revenue, Rp8.4tn of operating profit, and Rp10.97tn of net profit, of which Rp8.95tn — Rp142.02 per share — belonged to the parent's owners [5] [6]. Rp4.09tn of that pre-tax profit — 34% of the total — came from the share of profit of associates, the Obi Island processing plants Harita holds at 35% to 45% but does not consolidate [7]. The balance sheet mirrors that reliance: the investment in associates is carried at Rp23.68tn, 38% of the group's Rp61.8tn of assets (The Associate Stakes) [8].
Two facts keep that reliance from being a red flag on its own. The associates remit real cash: they paid Harita Rp1.98tn of dividends in FY2025, up from Rp1.44tn in FY2024 (The Associate Stakes) [9]. And the group is barely levered — Rp9.38tn of gross bank debt against Rp6.02tn of cash leaves net debt of Rp3.36tn and a gearing ratio of 0.07, down from 0.12 a year earlier [10]. The parts that follow take that solvency as settled and vary the one input that is not: the nickel price.
The variables that move the outcome
Three drivers set the range of outcomes, and they do not move together.
The first is the nickel price acting on the consolidated business, and its grip tightened in the first quarter of 2026. Revenue fell 4.5% year on year to Rp6.81tn, but gross profit fell 34.9% to Rp1.37tn and operating profit fell 45.7% to Rp1.05tn [11]. The volume ramp that carried earnings higher through the FY2022–2025 price crash (Price Sensitivity) has matured, so a small move in price now passes almost undamped into operating profit. The layer Harita fully owns is its most price-exposed one: consolidated RKEF processing earned a 20.6% gross margin in FY2025 versus 45.3% for captive mining, and when nickel fell in Q1 2026 a 4% revenue dip cut consolidated operating profit 46% to Rp1.05tn — group profit rose only because associate income tripled to 69% of pre-tax profit (Price Sensitivity).
The second is the associate line, which ran the other way. Share of profit of associates more than tripled in the same quarter, from Rp0.64tn to Rp2.15tn, and that is the only reason group pre-tax profit rose 26% while the consolidated business contracted [12]. The associates' HPAL economics carry a cobalt by-product credit (Cost Position) that the consolidated ferronickel business does not, which makes their earnings both larger and more volatile than the plants Harita owns outright.
Q1 2025 was 26% on the same measure; Q1 2026 is a single quarter, not an annual run-rate. Source: derived from the FY2024/FY2025 and Q1 2026 statements of profit or loss [13] [14].
The third driver is not price but policy. The LME cash price peaked near US$16,066/MT in March 2025 and drifted to about US$14,884/MT by December, a market the World Bank expected to fall roughly 9% for the year [15]. What briefly firmed the price into early 2026 was not stronger demand — the demand mix is shifting away from Harita's stainless-grade ferronickel (The Nickel Market) — but Indonesia's signalling that it might tighten ore-production quotas through the RKAB system [16]. That valve has teeth: peer Nickel Industries had its Hengjaya mine idled from mid-September until an RKAB extension was granted on 12 December 2025 [17]. The price recovery case rests on that supply discipline holding, which is a government decision rather than a company one.
Source: Q1 FY2026 interim statements, comparative columns [18].
Three price scenarios
The scenarios below are directional, not a forecast. Harita discloses no group cash cost and no price sensitivity, and discontinued unit-cost disclosure after mid-2024 (Price Sensitivity), so the LME bands are illustrative anchors for reasoning, not modelled break-points. The consolidated cash-breakeven estimate of roughly US$13,000/MT is derived from the 1H24 ferronickel margin and peer smelter costs, and cannot be pinned precisely from the filings.
Source: author's synthesis of the drivers established across this report; anchored to FY2025 profit [19], the Q1 2026 sensitivity [20], and the 30% dividend policy [21].
Recovery. If the quota discipline lifts the LME back toward US$18,000–20,000, the same operating leverage that hurt Q1 2026 works in reverse: with the RKEF fleet at capacity and a higher price, consolidated operating profit re-expands above FY2025's Rp8.4tn and the associate line adds to it. Reported net profit clears FY2025's Rp8.95tn, and the dividend — set at 30% of that profit — rises with it. The load-bearing assumption is that the recovery comes from Indonesia restricting its own supply, because demand is not doing the work.
Flat / grind. At a price near the FY2025 average, the consolidated business earns materially less than FY2025 — annualising the Q1 2026 quarter, closer to half, though one quarter is a weak base. Whether group profit holds up then depends almost entirely on the associate line staying near its Q1 pace of roughly Rp2tn a quarter rather than reverting toward the FY2024 rate of about Rp0.5tn. Because the dividend is 30% of a profit now heavily composed of associate income, the cash to fund it increasingly comes through associate remittances — Rp1.98tn in FY2025 — which are set by joint-venture partners, not by Harita alone [22].
Sustained trough. If the price settles toward US$12,000–13,000, the consolidated RKEF ferronickel business — a ~26% cash margin at mid-2024 (Price Sensitivity) — approaches cash breakeven, and consolidated operating profit compresses toward zero at the smelter level. The mining operation probably stays cash-positive; an independent 2022 study for the IPO prospectus put its cash cost near US$1,000/t of nickel, though Harita discloses no current group cash cost. The HPAL associates hold a thicker margin but lean on cobalt. Reported net profit falls, the dividend falls in rupiah with it, and the ONC carrying value's embedded goodwill — a premium over net assets held inside the investment and not separately impairment-tested [23] (The Associate Stakes) — is the balance-sheet item most exposed. What does not happen, even here, is a solvency event: net debt at 7% of equity and operating cash flow of Rp8.6tn (about 15 times FY2025 capex) keep the bankruptcy risk the reader most wants to avoid (The Business) near zero.
What to watch
Each item names a line in a specific filing and the reading that would change with it. All are checkable each quarter.
Sources: interim and annual statements as noted — profit or loss [24]; cash flows [25]; associate goodwill [26]; net debt [27]; RKAB precedent [28].
Where this leaves the case
At Rp825 the shares trade near Rp52tn, about 5.8 times FY2025 earnings and 1.35 times book, against a consensus 12-month target of roughly Rp1,570 — a value-priced, family-controlled producer that has kept growing through a nickel downturn, now down 47% from its February peak of Rp1,545 (Margin of Safety). The dividend policy fixes the payout at 30% of net profit, which — applied to FY2025's Rp8.95tn of profit to owners — implies a distribution near Rp2.7tn, roughly Rp43 a share, or a forward yield around 5.2% at today's price [29].
The evidence supports a specific, bounded read. The margin of safety this investor most cares about — the near-zero chance of the balance sheet failing — holds across all three price scenarios, because the group's 7% gearing and its heavy operating-cash-flow coverage of capex do not depend on the nickel price. What the price does control is the size and the quality of the reported profit: in a trough it shrinks, and an ever-larger share of it is associate income the company records before the cash arrives. The strongest fact against treating the low multiple as pure margin of safety is that its earnings base has already begun to contract — consolidated operating profit fell 46% in Q1 2026 — with a cobalt-boosted associate line, not price resilience, doing the offsetting. The read would tighten toward the recovery case if Indonesia's quota discipline turns into a durable price floor and associate cash keeps flowing at the FY2025 pace; it would tilt toward the trough case if the cobalt credit normalises while the LME stays soft. Both are visible, quarter by quarter, in the six lines above.